It is important to understand that phase response can be easily changed by cyclically shifting the impulse response and find a position where the phase response is the flattest.
However the practitioner must also consider one question: is the phase response meaningful?
Meaningful Phase Responses
Meaningful in this context is useful for engineering use. Please see two phase responses in figure 20 below.
Let us do some visual observations of figure 20:
—Red curve is a better looking (flatter) phase response curve.
—Too many phase wraps on the black curve especially above 1000Hz.
Both curves in figure 20 are referring to the same measurement file. The black curve has the correct propagation delay removal, the red curve on the other hand is placing the peak of the impulse at 0ms (such as using auto delay finder function) with the input’s polarity reversed.
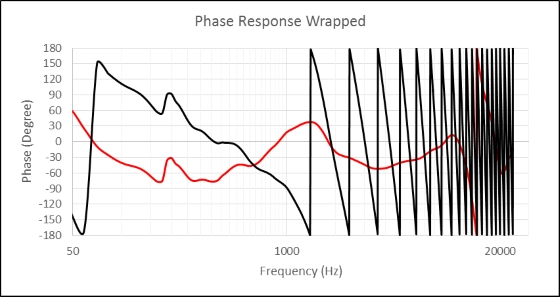
Figure 20
There are always ways to make the phase response look flatter, but it does not mean it is useful for engineering use. We will discuss more about the black curve below. Let us discuss phase response with a comparison example.
A 12-inch 2-way horn loaded loudspeaker is measured passively without DSP and bi-amped with DSP. Please observe the on-axis measurement results in figure 21. Red curve is bi-amped with DSP and black curve is passive without additional DSP.
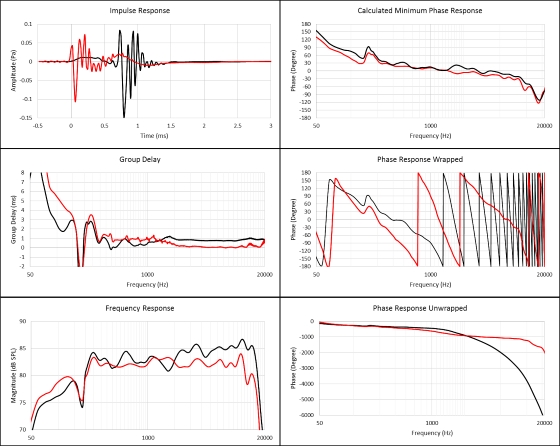
Figure 21