
Using the following equation:
1=T×f; Where:
T is period (second).
f is frequency (Hz).
We can calculate that 0.5ms is a period of 2000Hz. The period of a sound wave is the time it takes to complete one cycle (360°). Therefore, we can see that the phase is -360° at 2000Hz. For a frequency of 1000Hz, it requires 1ms to complete a cycle, thus the phase is shown at -180°. In other words, 1000Hz lags by a half cycle and 2000Hz lags by a cycle in the presence of 0.5ms propagation delay. Without removing the propagation delay, all frequency components of the input signal are shifted in time by the same constant amount. This is not a phase distortion.
If we change the X-axis (frequency axis) of figure 7 to a linear scale, we can see a straight line. Please observe figure 8.
Note: The negative value in phase shows a condition where the phase lags at that frequency.
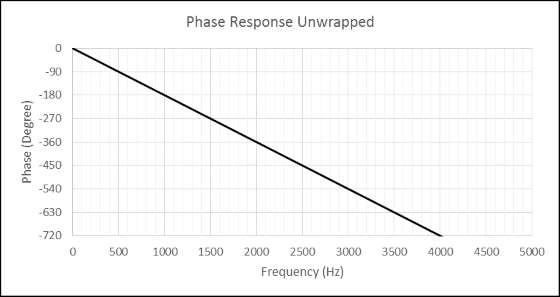
Figure 8
Another observation from figure 6 is the group delay. The group delay curve is at 0.5ms, corresponding to the 0.5ms propagation delay.
Let us observe what happens when the impulse is shifted 0.5ms too much. Please compare figure 6 and figure 9. Figure 10 is an overlay of phase responses from figure 6 (with 0.5ms propagation delay – blue curve) and figure 9 (removing 0.5ms too much of the propagation delay – red curve). The reader can observe the different direction of the phase response. Removing too much of the propagation delay will result in positive phase and negative group delay values.
It is important to understand that a small amount of propagation delay can drastically affect the phase response curve at high frequencies.
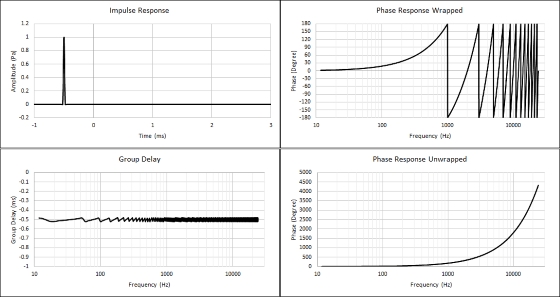
Figure 9
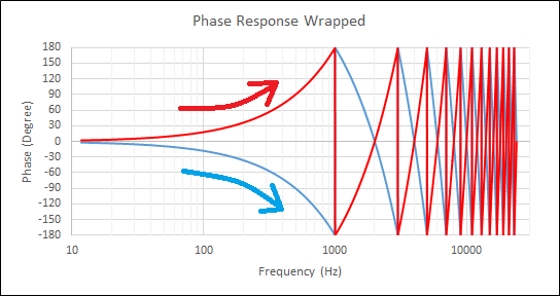
Figure 10
Removing Propagation Delay
Since propagation delay results in a linear phase shift, this can be easily predicted or calculated. A typical way of removing the propagation delay is cyclic shifting so the peak of the impulse is aligned at 0ms. It is commonly found in measurement software as auto delay finder, auto peak finder, normalize max to zero or others. This can be misleading for phase response reading if the frequency content above 1000Hz is lacking in intensity such as if influenced by a low pass filter.
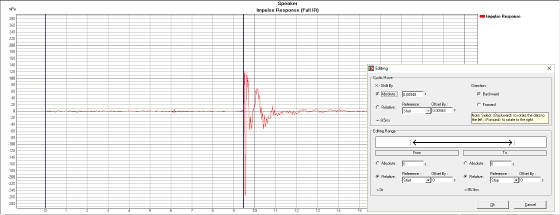
Figure 11
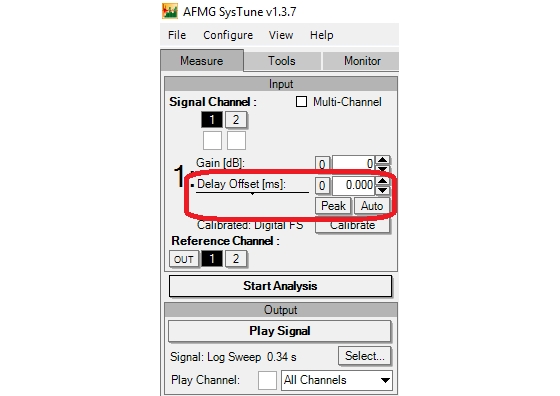
Figure 12
Figure 11 is a screenshot from EASERA where the user can remove the propagation delay manually by typing the delay amount under edit functions under cyclic move sub-menu.
Figure 12 is a screenshot from Systune where the user can remove the propagation delay manually by inputting the delay offset amount or using the peak button to cyclic move the impulse peak to 0ms.
Figure 13 is a screenshot from ARTA where the user can define the starting point of the impulse by placing the yellow cursor, thus removing the propagation delay.
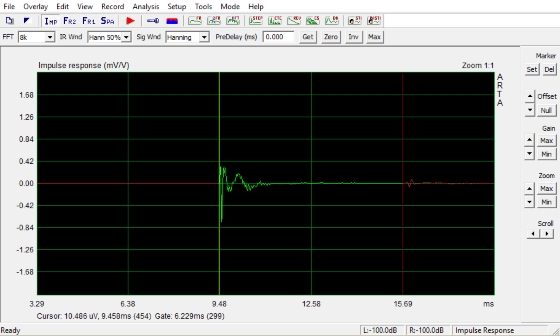
Figure 13