When an audio practitioner correctly removes the propagation delay in the impulse response, meaningful observations can be recognized. The discussions and observations below are focused to anything related to phase only.
—Calculated minimum phase response is different with the measured phase response.
This condition explains that the loudspeaker under test is not behaving as minimum phase system in both passive and biamp setup. Their transducers are likely minimum phase, but as a loudspeaker system, the introduction of crossovers either passively or actively invalidates the assumption of a calculated phase from the frequency response as would be with minimum phase systems.
—Drastic phase drops/wraps on black curve at high frequency (above 1000Hz).
The black curve is the loudspeaker run passively. If we notice the impulse response, the reader can see a small bump prior to the impulse peak. That small bump is likely the woofer impulse. It is smaller than the tall spike because the impulse response graph is ‘dominated’ by high frequency. When a low pass filter (at a frequency point below 2000Hz) is implemented to a woofer, the impulse height will be greatly reduced. The tall impulse peak is likely the tweeter, which comes later in time (approx. 0.7ms later).
Since the loudspeaker runs with a passive crossover, this shows a condition where the tweeter’s voice coil is located behind the woofer’s voice coil, typically caused by the depth of the HF horn. The woofer’s direct sound arrives first in the microphone and is followed by the tweeter 0.7ms later. As previously discussed in figure 6, the additional propagation delay (relative to the woofer that arrives first) creates the phase drops/wraps and creates higher group delay value at high frequency as discussed in the next point.
—Higher group delay value on black curve at high frequency (above 1000Hz).
Following the previous discussion, due to the arrival difference between the tweeter and the woofer, the reader can observe the positive value of the group delay near 0.7ms above 1000Hz. This simply means that the tweeter is arriving 0.7ms behind relative to the woofer.
The red curve group delay shows a curve at 0ms above 1000Hz. Comparing the red and black curves in the group delay and impulse response graphs, shows that a time delay is electronically used on the woofer to adjust the direct sound arrival difference.
—Higher group delay value on red curve at low frequency (below 100Hz).
If we notice the frequency response, the magnitude of the red curve is higher than the black curve. This explains that a boost is performed in the woofer’s low frequency region. This boost can be followed by high pass filter at lower frequency as processing are digitally implemented. Additional boost using parametric EQ and high pass filter will increase the group delay.
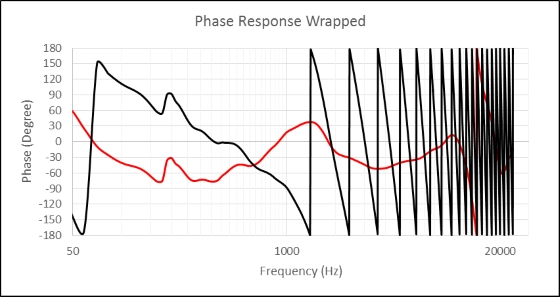
Figure 20
Let us go back quickly to figure 20, the red curve. The passive loudspeaker phase response can be shown flatter by placing the peak of the impulse response at 0ms and reversing the loudspeaker input’s polarity during measurement. While this can be used for marketing/showing-off purpose, the phase response is misleading and is not meaningful for engineering work.
Conclusion
By removing propagation delay correctly, audio practitioners can derive valuable engineering information from a phase response.
Hadi Sumoro and Xian Yu are principals of HX Audio Lab, providing acoustic/audio consultation for almost a decade. The authors would like to thank Pat Brown (www.ProSoundTraining.com), Riccardo Balistreri and Chris Devenney for their insights and for reviewing this article prior to publication.
You can find a PDF of this article here.