

In the current digital world, audio analyzers with FFT or TDS functions are easily able to show the magnitude and phase response of a loudspeaker.
These software analyzers are not expensive and are widely used in live sound, installation and loudspeaker development. Several popular software analyzers are ARTA, Smaart, Systune and EASERA. And there are many others.
Phase response is often questioned. Many practitioners use the software functions such as: delay finder, auto delay finder or phase compensator to check phase response. However, most do not understand the basic principle behind the function. This article will discuss how to set a correct time reference to view phase response and assumes readers have experience in loudspeaker measurement.
Impulse Response and the Digital World
First, let’s discuss an impulse response graph.
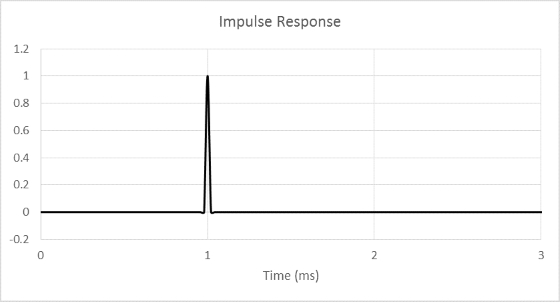
Figure 1
Figure 1 shows a perfect impulse response (Dirac pulse) with the peak at 1ms. This is a time domain graph showing that:
—An impulse of energy is detected at time = 1ms.
—The propagation delay of the signal is 1ms.
—The Y-axis shows a value of one, which shows the signal amplitude is +1.
If we zoom in a little bit, we can see in figure 2 that the impulse response starts before 1ms. The question is does this mean the exact arrival is just slightly before 1ms?
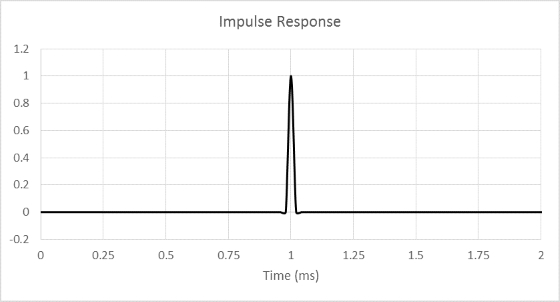
Figure 2
In visualizing a graph, a line is graphed to connect the dots. This helps us to see what is being graphed more easily. Let us see how figure 2 looks like when we only show the X and Y values with a dotted graph.
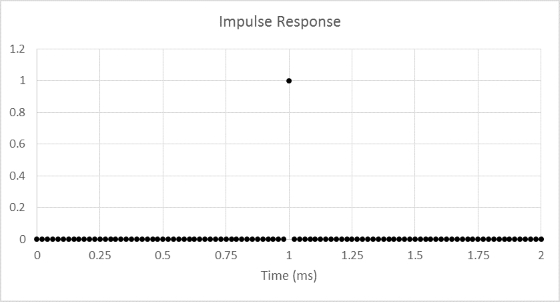
Figure 3
In figure 3, it is clear that the impulse only contains one energy spike that arrives exactly at 1ms. Understanding where an impulse response starts is the first step in reading the phase response. Not all analyzers can show a dotted graph, but it is important that we understand where the line/curve comes from in digital equipment.
Note: in digital, all values are discrete (not continuous) and the resolution of the time plot is determined by the sample rate. A Dirac pulse contains only one sample.