
Several observations:
—At low frequency (below 200Hz), the phase value is positive due to the high pass condition (frequency response is rising up).
—At high frequency (above 8000Hz), the phase value is negative due to the low pass condition (frequency response is rising down).
—At frequencies around 1000Hz, the phase value is close to zero. This condition is expected since there are no changes in the frequency response at mid frequencies.
One little observation is the impulse peak that is shifted right a little bit. Let us observe figure 16 where the impulse response graph is changed to a dotted graph.
From figure 16, it is clear that the initial arrival of the impulse is correctly placed at 0ms.
Most analyzers do not have the capability to change the graph from line to dotted graph, therefore it is important to always observe the transfer function (magnitude and phase responses) and impulse response at the same time.
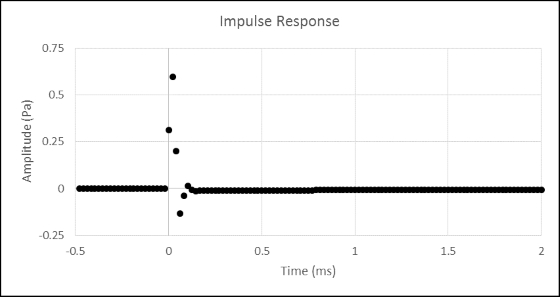
Figure 16
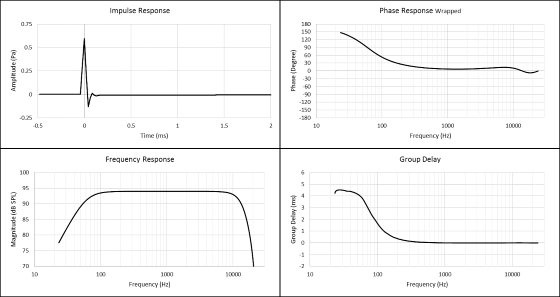
Figure 17
What happens if an auto delay finder is used? Let us observe figure 17.
—Frequency response does not change when the impulse response is cyclically shifted.
—The impulse response peak is placed at 0ms.
—Phase response becomes flatter, however please notice the values are positive/above 0deg up to 10000Hz. Positive values in phase can be an indicator that the impulse response is shifted a little bit too much, especially knowing that the frequency response is flat in the mid frequencies and rising down at high frequencies (above 8000Hz).
A phase response that has positive values can be observed in the next example, figure 18. A 2in woofer in a small closed box is measured at 1m away. The measurement is done without electronic filter and is a minimum phase system.
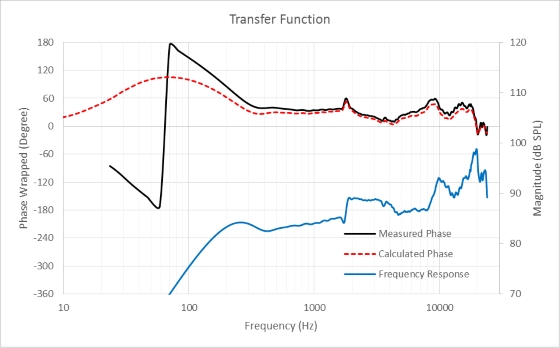
Figure 18
Several observations from figure 18:
—The calculated phase is the minimum phase response calculated from the magnitude response in ARTA. The calculated and measured phase responses are laying on the top of each other, showing that the propagation delay is correctly removed from the measured data.
—The phase values are positive all the way to 20000Hz. This is caused by the magnitude response that is rising up.
—Figure 19 points out the minimum phase condition by comparing figure 18 and 14. Please note the two green rectangular areas. Below 200Hz, the frequency response is rising; therefore, the phase response starts positive and goes down as shown in the figure 14 inset, graph A. At high frequencies, e.g. around 10000Hz, the measured frequency response follows graph C in the figure 14 inset. The reader can observe how the phase responses match between measured, calculated and graph C in the figure 14 inset.
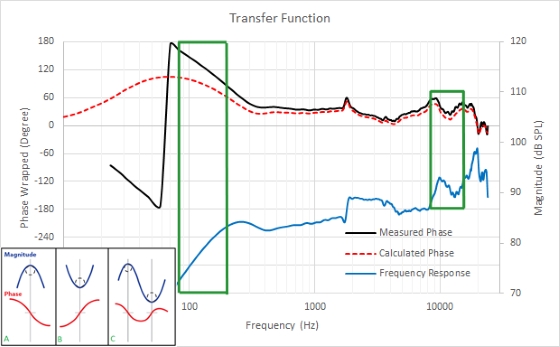
Figure 19