
We live in an age of “bigger is better.” During a recent SynAudCon Forum thread, I suggested that this philosophy is not necessarily true for the length of an FIR filter.
As of this writing, the typical filter length supported by DSP is 1024 taps, with some as high as 4096 taps. Why would I not want or need longer FIR lengths? If a manufacturer introduced a 8192 tap FIR in its DSP, wouldn’t I want to pass over competing units and buy it?
Lower Frequency, Longer Time
First, we need a file for practice and experimentation. A loudspeaker measurement could be used, but a simpler file will make some of the important points more obvious.
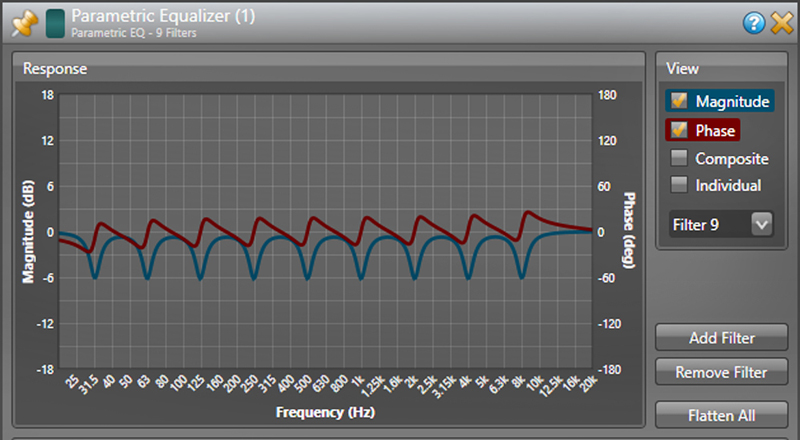
As a reference, please see Figure 1. I created this series of boost filters (ISO octave band center frequencies) in FIRCapture software and saved it as a WAV file. The response could have just as easily been produced by any 9-band parametric EQ.
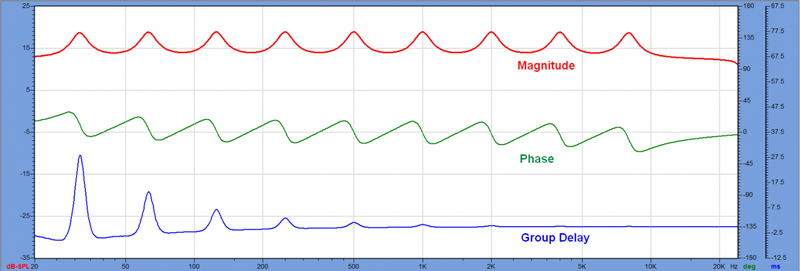
I selected a Q = 6 to minimize the overlap of the filters. This group of filters forms a filter in and of itself, and is not unlike the response of a loudspeaker, less the requisite high pass and low pass response at the frequency extremes. If this were a loudspeaker (let’s pretend that it is), we might wish to equalize the bumps to produce an overall flat response. This file gives us a good way to examine the frequency resolution of FIR filters.
The frequency domain display shows the frequency response magnitude, phase, and group delay. Note that the phase and group delay are alternate ways of showing how the filter modifies the time behavior of the signal that passes through it. Since phase is relative, the phase behavior of each bump is the same.
From an earlier installment, the minimum phase response of a band pass filter starts positive, goes through zero at the filter’s center frequency, and ends up negative. This phase shift produces frequency-dependent ringing for signals passing through the filter. The duration of this ringing is shown by the group delay plot.
Figure 2 is a joint Frequency/Time view of the filter. Figure 3 shows the acoustic wavelengths for each ISO octave center. The relevance? Since the speed of sound is about 1 foot/millisecond (ft/ms), the wavelength approximately equals the time period for one cycle at each octave center. Wavelength serves as a visual reminder that sound waves span time and space, and so must the response of a filter.
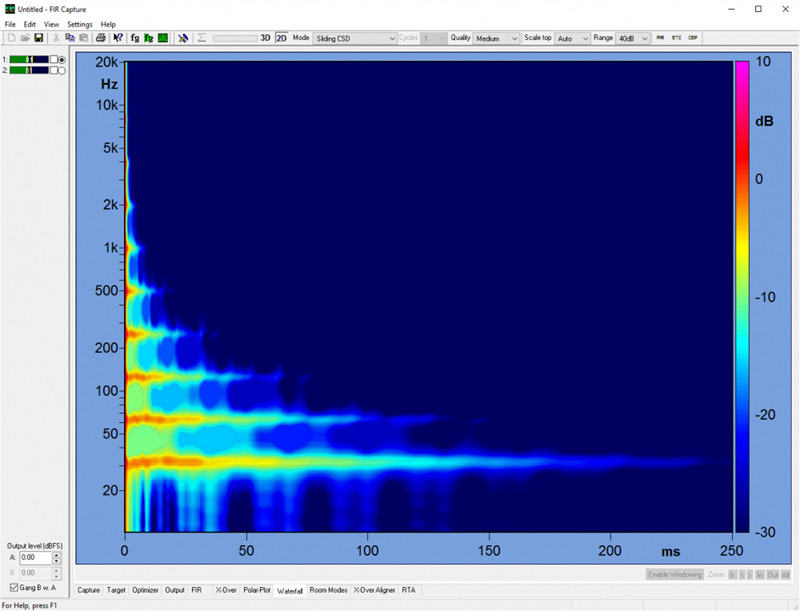

The group delay (GD) will be proportional to the wavelength of the filter frequency, increasing in length with decreasing frequency. While the name implies that the signal is delayed as it passes through the filter, this is a bit misleading. The storage properties of the filter cause ringing, where extra cycles are added to the signal.
The GD shows the time span that the boost filter occupies. There is nothing strange happening to produce the very long ringing for the lower frequency bumps. It is inversely proportional to filter frequency (proportional to the wavelength), and a given amount of phase shift will produce a longer group delay with decreasing frequency.
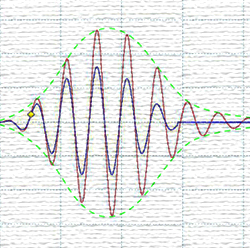
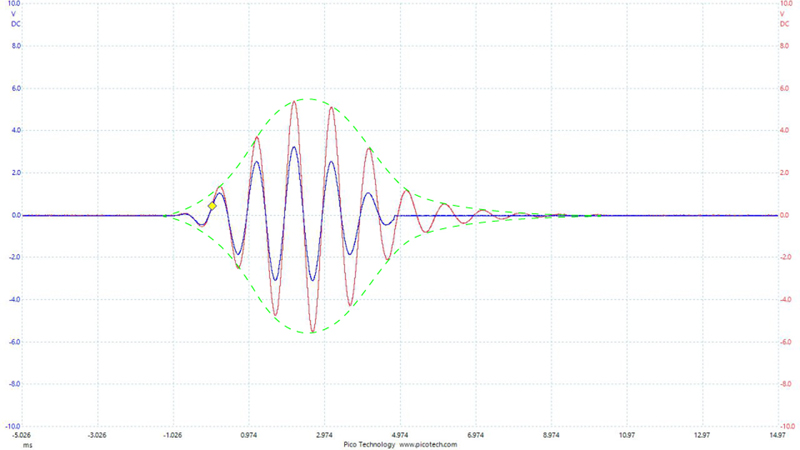
To demonstrate, consider the signal processing chain shown in Figure 4. Let’s pass a tone burst through it and see what happens. Figure 5 shows the result as viewed on a 2-channel oscilloscope. The blue trace is a 1000 Hz 6.5 cycle wavelet. This is one of Don Keele’s shaped tone burst signals. The red trace results from passing it through a 1000 Hz boost filter. Note that the original and filtered signals are in phase, and that the filtered signal has extra cycles. This is time domain ringing. The ringing of a cut filter would span the same amount of time.

IIR Equalization
What must an analog or digital IIR filter do to correct the response? Either must simply produce the opposite magnitude response and phase shift of the bump. Since IIR filters are recursive (utilize feedback) the filtering process happens “on the fly” based on the driving signal (think of a capacitor charging and discharging).
As such, there are no low frequency limits on its operation (at least compared to an FIR filter) and it doesn’t introduce a significant amount of processing delay. There will be an output signal so long as there is an input signal, and the filter’s impulse response (theoretically) never decays to zero.
Since a positive group delay is the signature of a narrow band boost filter (Figure 1), a negative group delay is the signature of a cut filter. It means that the phase angle has decreased over the frequency span of the filter. Figure 7 (below, following Figure 6) shows a group of IIR filters realized in an EQ block of a popular DSP. Compare the magnitude and phase of each “dip” with the magnitude and phase of each “bump” in Figure 1. The equalizer in Figure 7 would completely correct the response of my example file.
As a side note, for narrow band signals the GD is not a measure of signal delay, but it does show the time span occupied by the filter’s ringing. Some terms in audio don’t literally mean what their name implies. “Constant voltage” is another example, but that’s a different article.
Minimum Phase FIR EQ
In lieu of an IIR filter, let’s consider a minimum phase FIR. Its response can be made identical to the IIR filters produced by the parametric equalizer. An important difference is that the FIR filter’s response exists in totality independent of the signal that drives it. It is an impulse response of finite length, with a corresponding frequency resolution that is dependent on its length.
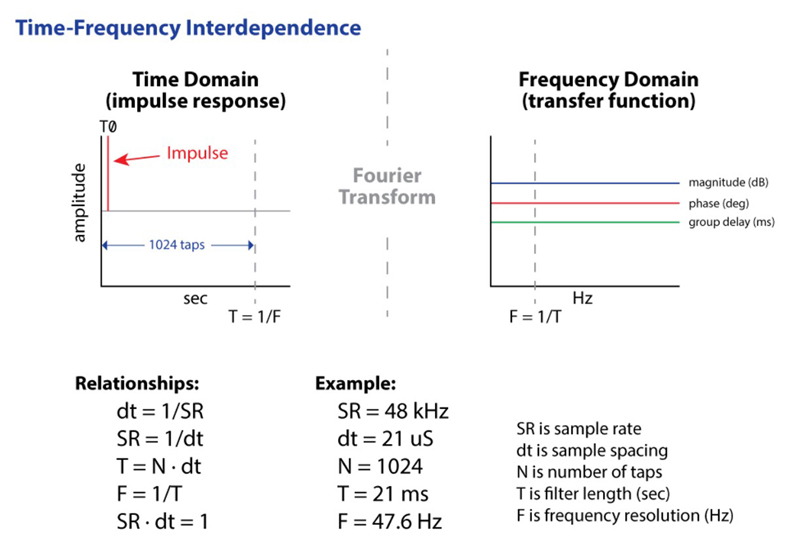
Since T = 1/F, the lower the frequency to be affected, the longer the filter length (time span, more taps) required. Correction of the LF bumps requires introduction of the conjugate of the magnitude and phase at each frequency, which also conjugates the GD. That’s a long time span for the lower frequency bumps.
Refer back to Figure 1 again for a good visual. Because the filter is minimum phase, the processing delay is very low, just like the IIR filter. The difference is that the FIR filter’s bandwidth is determined by its length (Figure 6), so a very long filter is needed to equalize the lower frequency bumps. This fact is independent of the processing algorithm used to create the filter.
Frequency Resolution
From Figure 6, a minimum phase FIR filter with 1024 taps and 48 kHz sample rate will have a length of 21 ms. Since T = 1/F, this makes the frequency resolution of the filter about 47.6 Hz.


