
In working with sound and acoustics, here’s something many of us do but may not actually think about enough: Comparisons between measured and predicted reverberation times (RTs).
RT (a.k.a., “RT60,” “T60,” “T,” et al) is a widely used quantifier of the acoustical behavior of a room. Sound decays in a room. (Albeit less quickly in some rooms than in others, as we’re all painfully aware.)
RT is defined as how long it takes sound in a room to decay by 60 dB in a particular band. This is a very useful measuring stick.
There has been a lot of research on the applicability of RT as a useful measure.
Further, there are probably hundreds of graphs and tables that provide useful guidelines for evaluating RT for different sizes and types of rooms.
Figure 1, below, is a typical example, taken from Everest’s Master Handbook of Acoustics (third edition).
The handy thing about RT is that it is very easy to calculate.
There are several widely used formulas, all of them relevant to different situations.
The “Sabine” equation is the most common and is extremely useful for predicting RTs of large, reverberant spaces like gymnasiums.

There are also various other equations—“Eyring-Norris,” “Millington-Sette,” “Fitzroy,” etc.— that are all applicable for different circumstances. There are online also calculators that employ these equations, programs that use them to calculate the RTs of a room.
You can even develop some fairly simple spreadsheets to run the calculations — I have one on my PDA! (Figure 2)

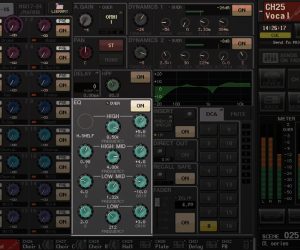
Then there is the measurement side. RT measurements can be performed in different ways, all very relevant and accurate.
Some systems are automated, some are not. Some simply measure the sound decay directly. (Figure 3)
.jpg "Click to enlarge")
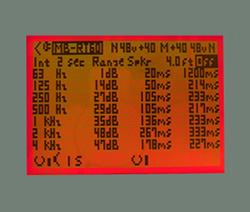
Others measure a room/system transfer function and will give you energy versus time graphs where you can either manipulate the start- and end-points yourself to derive the RTs, or have the program do it for you automatically. (Figure 4)

Programs that provide a “Schroeder” reverse integration of the energy versus time graph are quite useful; a quick visual inspection of the Schroeder curve can tell you whether the single-number RT being reported is applicable.
It may not be if, for example, the curve exhibits “double-slope” behavior (common with coupled spaces) which would throw off the automated decay calculation.