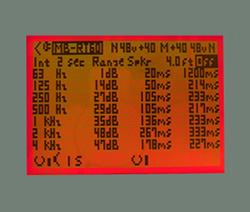
Regardless of how RTs are predicted and measured, one trap we’ve all fallen into is directly comparing the measurements to the predictions.
Why is this bad? Well, in the most general sense, it is not. There are certainly worse mistakes we can make.
But when predictions of RT are made using the common equations, or spreadsheets/programs employing them, they are predictions for the entire room.
There is no spatial dependence on the predictions because they are statistical computations. They assume that the room is uniform in its distribution of sound. The term “diffuse sound field” is often used to describe this assumption.
And it is a BIG assumption, typically overlooked completely in circumstances where one or a small handful of measurement points are evaluated and individually compared to predictions for the entire room. This is not a “best practice.”
The calculations say, “These are the RTs for the room.” The measurements say, “These are the RTs at this point in space.”
A better way to compare the RTs is to measure them at no fewer than four different positions in the room and average the results. Even better would be 10 positions or more.
Thankfully, there are tools available nowadays that make this many measurements quick and easy. You can even average as you go! (Likewise, there are tools that now provide for “probing” a room to provide “point in space” predictions. But I would guess that these are not as widely used as the more “quick and dirty” calculations of RTs using spreadsheets, online “calculators,” and the like.)
The same can be said of the intelligibility quantities that are predicted and then measured.
Care should be taken wherever spatial dependence is ignored in one and inherent in the other.
One popular program provides predictions of speech intelligibility in the form of “mappings” of the audience areas. (Figure 5)
To verify whether these predictions have in fact been met, several measurements for each relevant area should be averaged.
Finally, when presenting comparisons, the spatial dependence of the measurements versus the statistical assumptions of the predictions is something that requires attention.
Be sure to state assumptions. Be sure to make as many measurements as you can and average the results prior to making such comparisons.
Besides being more accurate in terms of reporting results, the presentation of the data can be a lot easier to understand for someone who may not have as good a grasp of acoustical concepts.
Comparing one number to another is always easier than sifting through a huge table of numbers.
Jeff D. Szymanski is an acoustical engineer with over 15 years of experience in the acoustical manufacturing and consulting industries. He has written and presented extensively on the subjects of acoustics and noise control, and most recently authored the chapter on “Acoustical Treatment for Indoor Areas” for the fourth edition of the Handbook for Sound Engineers (Focal Press, 2008). Jeff is a full member of the Acoustical Society of America, is Board Certified in Noise Control Engineering through the Institute for Noise Control Engineering, holds two US patents, and is a licensed professional engineer.

