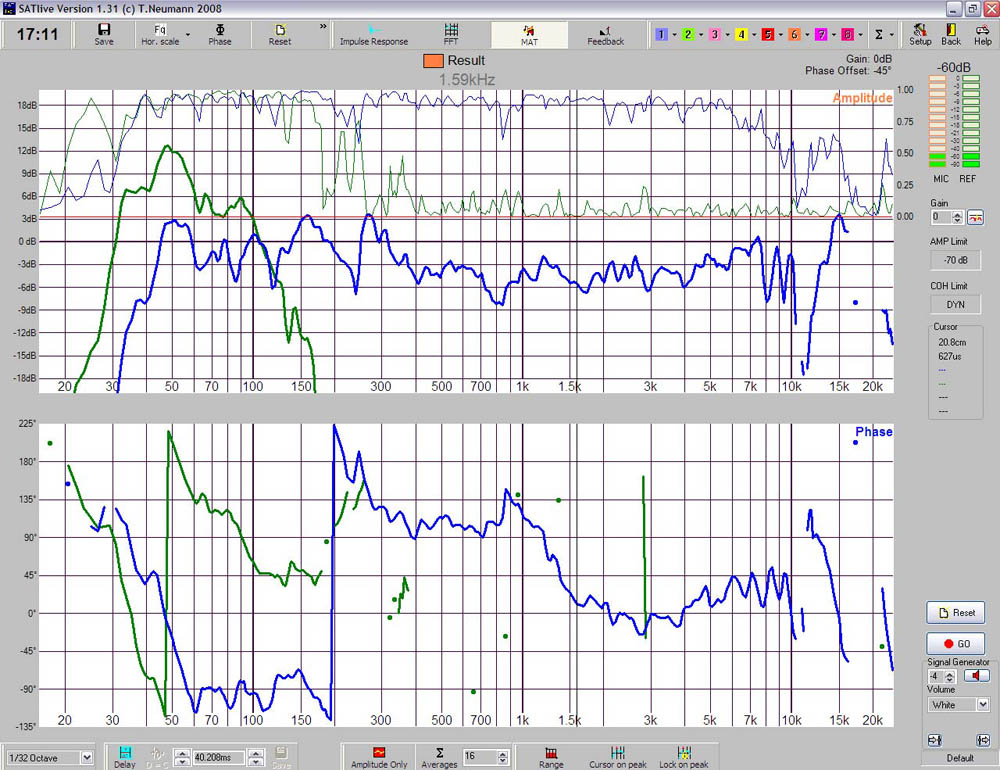
8) Measure the subwoofer, and compare the phase curve with that of the mid-high box. The result can be seen in Figure 22.
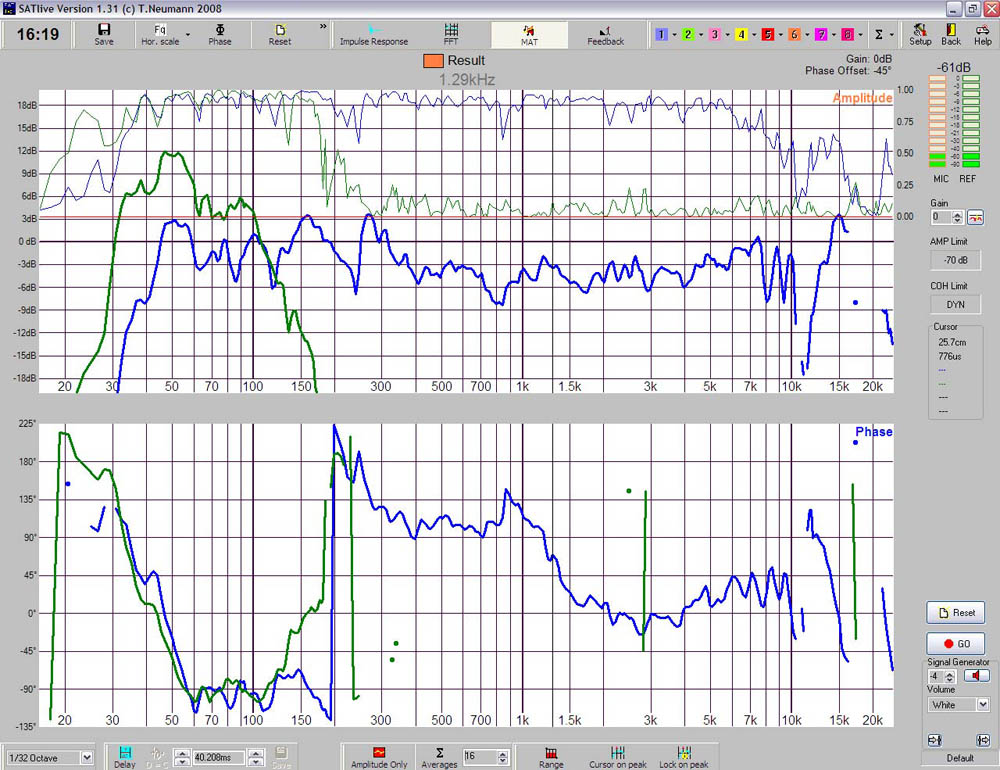
9) Add or subtract delay from the subwoofer output until the two phase curves overlap around the crossover frequency, as seen on Figure 23. Do not forget to save the curves.
In this example the phase trace for the subwoofer shows a steeper slope at the pass-band than the mid- high system.
It is evident that some delay will need to be removed from the subwoofer until the phase curves overlap as much as possible in the band that they share.
When reducing the delay time for the green curve on Figure 22 it will shift upwards, eventually disappearing and appearing again on the lower part of the graph.
We need to bear in mind that the phase graph only shows values between +180º and -180º. If a larger range were to be used, the traces would not zigzag as they do here.

10) Measure the system frequency response and compare it with the initial measurement.
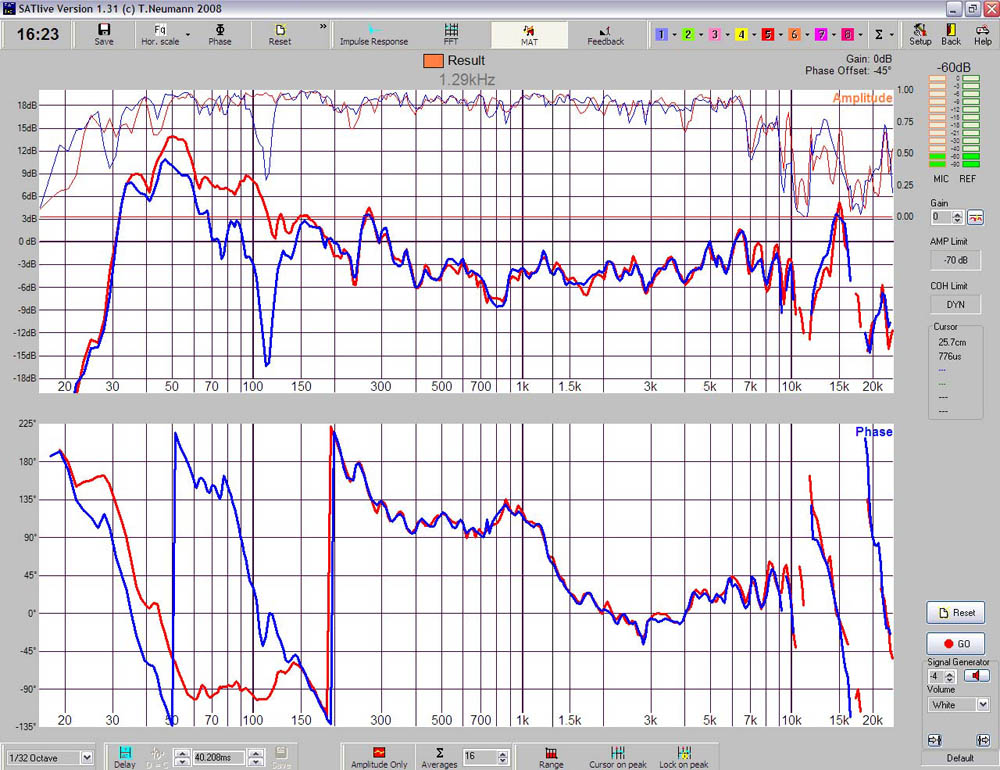
If phase has been correctly adjusted, subwoofers and mid-highs will sum in phase, and this will be reflected on the magnitude frequency response.
Figure 24 compares the system combination before (blue trace) and after (red trace) adjustment.
Cancellation and poor coherence that were previously seen around 125 Hz have disappeared.

As noted above, low coherence was due to the fact that the same frequency band was arriving at different times, which is equivalent to a reflection of similar SPL.
Once the correct amount of delay is added, the shared band from the two systems arrives at the same time and coherence goes back to normal.
11) Take the lowest delay value and subtract it from the subwoofer and mid-high so that at least one of the outputs has a delay time of 0ms.
The DAS Aero 50 mid-high is a 3-way line array system with external amplification. Resulting delay times are as follows:
DAS LX218A
- Subwoofer: 14.458ms
DAS Aero 50
- Low: 20ms
Mid: 25.9167ms
High: 26.0104ms
What we are really after is the time difference for the outputs to be phase aligned. Therefore, the lowest delay of all bands (14.458ms in this case) needs to be subtracted from each of the bands. Final delay times will thus be:
DAS LX218A
- Subwoofer: 0ms
DAS Aero 50
- Low: 5.542ms
Mid: 11.4587ms
High: 11.5524ms
Once the final delay times have been entered, it is good practice to run the measurement again to check that everything is correct.
Before adjusting a real system for the first time, it makes sense to practice this procedure as often as possible and with whatever combination of gear we happen to lay our hands on, until we have mastered the technique.
Using scaled down systems will allow us to become familiar with the procedures until we are confident to try larger systems.
This was the final part of our series. Want to save this article for future reference? Head on over to the DAS Audio Website where you can DAS Audio Engineering Department.

