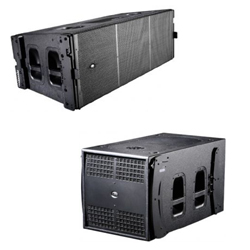
8) Measure the subwoofer and compare the phase curve with that of the mid-high box. The result can be seen in Figure 16.
9) Add or subtract delay from the subwoofer output until the two phase curves overlap around the crossover frequency. Do not forget to save the curves.
It is not very obvious in this example whether the subwoofer needs delay to be added or subtracted. Let’s try both and see which one works best.

Option a) Remove some of the delay from the subwoofer output. The green curve will shift upwards.
The delay on the subwoofer output ended up at 18.270ms. We have adjusted the delay time until the phase traces cross each other at the acoustical crossover frequency.
This way they sum perfectly in phase at that frequency. Above and below that frequency there is phase difference that needs to be evaluated when comparing the different sums for the boxes with the different delay times.

Option b) Add delay to the subwoofer output until phase values are the same at the acoustical crossover frequency.
Phase matching is better above the crossover frequency than below it. Again, we will evaluate the result on the next step.
10) Measure the system magnitude frequency response again, and compare it to the initial measurement.
If phase has been adjusted correctly, the sum of the mid-high and the subwoofer will be better, and the magnitude frequency response will reflect this.

Figure 19 compares both boxes without delay (red trace), with 20.848ms delay on the subwoofer (green trace) and with 18.270ms (blue trace).
It can be clearly seen that the green and blue traces significantly improve the magnitude frequency response. However, there is no significant difference between them.
11) Take the lowest delay value and subtract it from the subwoofer and mid-high so that at least one of the outputs has a delay time of 0ms.
Let’s say we pick the blue curve. There’s a delay of 20ms on the mid-high and 18.270ms on the subwoofer.

Since we had added 20 ms just as an arbitrary amount to be able to add or subtract from that as needed, once the adjustments have been made we no longer need that excess delay: subtract the lowest delay time from the two outputs so that one of them has 0ms.
In our example the mid-high output will end up with 20ms – 18.270ms = 1.73ms. The subwoofer output will have 18.270ms – 18.270ms = 0ms.
If we wanted to run the same exercise with speakers of different size, we would just need to find the ratio between the subwoofer we mean to simulate, and the speaker to be used for the measurement.