This is a discussion of line array high-frequency output capability, and what it might mean to you.
The specific quantity we’re looking at is the frequency response at maximum output power for all drivers. This is the maximum acoustic output of the array as a function of frequency. I will call this the power-bandwidth response.
POWER-BANDWIDTH RESPONSE
Here’s a question: what power bandwidth must line array elements have in order to deliver a flat frequency response to audience seats? Because of the way array elements work together (or don’t), we can’t assume that the overall array will have a flat frequency response just because the individual boxes do.
In particular, practical applications require the array to be curved to achieve the desired coverage. Whenever a line array is curved, its output falls off in the high frequencies.
For example, in the graph at right, from one of my line array modeling programs, shows the frequency response of a progressively curved line array – eight boxes, interbox angles increasing from 0 to 6 degrees – at a distance of 100 feet. The boxes are assumed to have flat frequency response.
As you can see in Figure 1, the high-frequency roll-off is about 18 dB. This means that in order to deliver a flat frequency response at 250 feet, the output capability of the individual line array boxes must be 18 dB greater at the high-frequency end. Wow.
This is a typical case. Usually, the high-frequency boost needed is between 12 and 20 dB. More highly curved arrays require more boost.
Why?
Line arrays have lower gain at high frequencies because of the way the sound waves combine at the listening position. The vertical pattern of each individual line array box is very wide at low frequencies, but narrower at high frequencies.
Therefore, if you’re listening to a curved array, at low frequencies you’re hearing all the boxes, but at high frequencies, you only hear the boxes where you are within the vertical coverage of their horns at a given frequency. Loud bass, quiet treble.
If you’d like to see this principle set forth mathematically, I suggest reading a 2001 AES paper by Dr. Christian Hell, the physicist who crystallized the modern theory of line arrays, and his colleagues Marcel Urban and Paul Bauman. It’s entitled “Wavefront Sculpture Technology,” and is available as a .zip file for free download from the L-Acoustics website.
With such large high-frequency output requirements, it’s a good thing that compression drivers are so efficient. Or are they?
We think of compression drivers as powerful high-frequency engines. In fact, they’re powerful upper midrange engines. All compression drivers roll off on the high end, above what is known as the “mass breakpoint” frequency. The mass breakpoint frequency is the frequency above which the inertia of the diaphragm can no longer be ignored. It’s usually around 3,500 Hz.
Figure 2 shows the unequalized frequency response of a typical modern compression driver. This is an actual curve (smoothed, of course) for a modern name-brand unit with a 3-inch diaphragm, 1.5-inch throat, and neodymium magnet. The red line is the actual acoustic output of the driver.
The magenta line shows the effect of attaching the driver to an older hom with non-constant directivity. In such horns, coverage patterns narrow in the high frequencies, squeezing the diminishing amount of treble into a smaller space. If you’re standing on-axis, this masks the mass-breakpoint effect.
However, in modern line arrays, constant-directivity horns are used, and the results more generally resemble the red line.
So what is the power-bandwidth response of a complete line array box?
Here’s a typical small line array loudspeaker:
WOOFERS: Two 8-inch, sensitivity 95 dB @ 1 watt/I meter, 200 watts max input each
TWEETER: One 3 diaphragrn/1.5-inch throat, 80 watts max input
CROSSOVER: 1,500 Hz
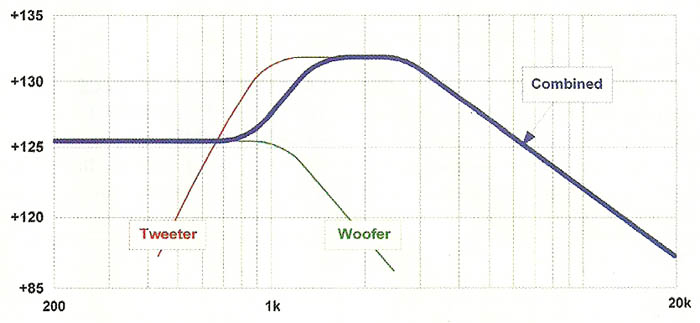
Figure 3 shows such boxes are available from a number of manufacturers. Taking into account the crossover, the efficiencies and power handling abilities of the three transducers, and mutual loading effects of the two woofers, the estimated power-bandwidth response of the box.
The green line is for the woofers, the red for the compression driver, and the blue is the combined overall result.
Surprising, isn’t it? Particularly since we said we needed more high-frequency output, not less. And it gets worse.
Let’s make a line array out of these boxes and estimate the power-bandwidth response of the whole array (Figure 4). We choose a prediction location of 100 feet on axis.
The red line is the maximum SPL available from the array, given the maximum input conditions described above. It shows that the array has about 20 dB less “horsepower” at 15 kHz than at low frequencies. Yikes.
Note that the red line doesn’t show the low-level frequency response. If the array is operating well below (well below) maximum output, the frequency response can be equalized as flat as we want.
However, this will require a large high-frequency boost. There is nothing wrong with providing such a boost, until a loud high-frequency signal – a cymbal crash, for instance – comes along. When such a signal appears, it will trigger the drive limiter. The limiter will reduce the gain of the entire crossover band.
For our example, this means that everything above 1,500 Hz will be attenuated. Thus, high-amplitude high-frequency signals will modulate the whole high-mid band, including vocals and other instruments. That’s a problem. But how bad a problem?


