A Computer Model
Acoustical behavior is often difficult to predict due to the complex nature of waves propagating in space.
This is especially true at high frequencies, where intricate room geometries diffuse the waves. Low frequency wave behavior is fairly predictable for “box-shaped” rooms.
Acoustics texts have published tables of “golden ratios” for many years to aid in selecting the proper size for the “shoebox” listening space. The well-established wave equation has an exact solution for such spaces. I used the Room Sizer application from RPG Diffusors to predict the modal behavior of the Plexiglas models.
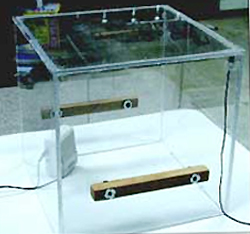
Again, I scaled the room model by a factor of 10, so my one-third (1/3) meter cube became 3 meters by 3 meters by 3 meters (10 feet by 10 feet by 10 feet) in the software. (Editor’s note: The dimensions are not exact, because it does not matter much at these wavelengths.)
The frequency axis of the measured data is then divided by 10 to complete the scaling and correlate the measured data to the predicted data. The mic and loudspeaker were placed in opposite corners — the usual practice for measuring a room’s modal response.
Room absorption is difficult to scale, so the vertical (level) axis of the predicted data will be inherently less accurate than the horizontal (frequency) axis. In addition, small frequency discrepancies will also be produced by the inaccurate absorption values.
Even with these caveats, there is excellent correlation between the predicted and measured data in the region for which Room Sizer and other modal prediction applications are optimized.
It is of tremendous benefit to be able to predict low-frequency room responses in advance without building scale models, when geometry can still be changed to produce a desirable behavior. This can reveal whether treatment can be needed, and even at what frequency it might be needed.


Favorable room geometry is only part of the requirement for good low-frequency response. It is also necessary to place the loudspeaker and the listener at positions that exploit the favorable geometry. To investigate this, tape the mic to a stick and move it about the box while observing the response in Smaart.

The graphic below shows a listener seat that has a huge “hole” in the bass response, even with good woofer placement and good room geometry. This, too, is predictable. The Room Optimizer application can be used to place the loudspeaker and listener in the room at positions that optimize low frequency behavior.

Conclusion
We now have enough information to form a priority list for achieving good low frequency behavior in small listening rooms.
The steps, in order of priority, are:
Room shape
Loudspeaker/listener placement
Room treatment
Electronic equalization
Pat & Brenda Brown lead SynAudCon, conducting audio seminars and workshops online and around the world. For more information go to www.prosoundtraining.com.
SynAudCon is now offering “Audio Applications – System Optimization & EQ” as web-based training. Click the link to see the related article.
More Church Sound articles by Pat Brown on PSW:
How To Illuminate The Audience With Beautiful, Consistent Audio Coverage
Ten Reasons Why Church Sound Systems Cost More
What Makes A Quality Loudspeaker?