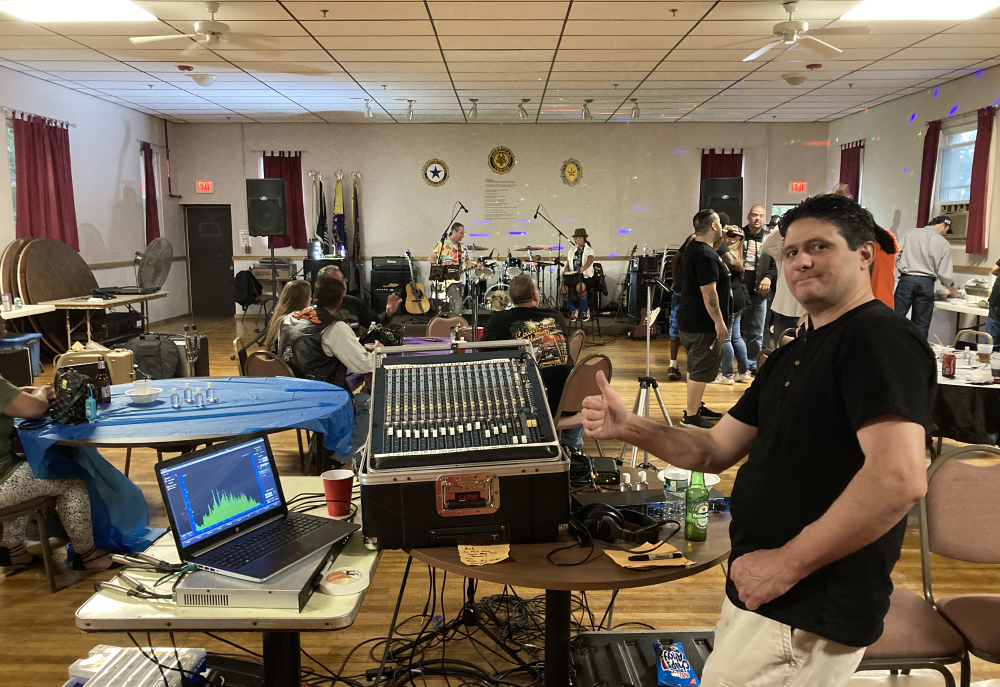
The live event industry has been slow for this engineer over the past months so when a good friend, Aaron, mentioned that he was playing with his second band at an American Legion for a benefit concert, I jumped at the opportunity to have a little fun and create the best possible result with the equipment I was given.
I showed up the night before and met with some of the band members and we talked about their needs and I was able to look over some of the equipment, take measurements of the room and listen to the natural acoustics.
As I was thinking about my strategy for DSP settings, I began to realize that I would be working in a special set of circumstances. Aaron was using a Peavey bass amplifier, the mains for the audience were also Peavey and so were the large subwoofers. This means that the odds are much better that the low end emitted from all the woofers would align and sum well because generally speaking, manufacturers design their products to do so. I created a file for a Biamp Nexia DSP (the best-kept secret in pre-owned DSPs!) and tried to anticipate all that I may need onsite. Testing a hypothesis that of attaining a good result by using all-pass filters (APF) to align the show’s low-frequency energy by placing them on the mains and sub.
Pursuing A Theory
The experiment that took form was my hypothesis that I could get good results by using all-pass filters (APF) to align the low-frequency energy by placing them on the mains and sub. My goal was to avoid using delay on the mains in order to refrain from adding latency in the mid and highs, which would delay the direct sound and already late reflections coming back to the lead and background vocalists from the hall boundaries (the hall measures about 70 by 38 feet).
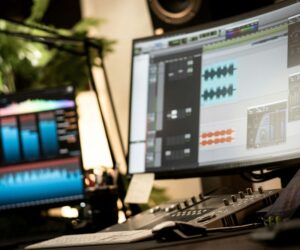
The DSP configuration ended up with meters on the inputs and outputs, a matrix mixer, crossover filters on the main and sub channels, a parametric and low shelf on the mains, limiters on everything. In addition, I put a 3-band APF on the mains and a 5-band APF on the sub (Figure 1).

The layout of the hall is represented in Figure 2. The Peavey mains were quite wide but fit rather nicely on the edges of the stage. After some consideration, I ended up going with a center sub in the middle of the room and bridging the amplifier vs running two subs each on a separate channel on the amp. The large stage wedge for the lead singer (and anyone else in its way) ended up needing to go back-to-back with the audience facing subwoofer. I looked at several options for this and the first is shown in the figure – this is with both the sub and wedge at normal polarity.

In this setup, the bass frequencies were spread out from left to right and there was less of it on stage. This matched the wide dispersion of the horns on the mains better, but I wanted to change it to the next specification, which involved a polarity flip on the wedge.
As a result, in Figure 3 we can see that the bass energy was thrown onto the stage and into the audience a little more and the nulls appear to the sides of the cabinets. A quick note – software programs such as Meyer Sound MAPP XT are only an accurate representation of the loudspeakers that are in their database. In real life, the Peavey loudspeakers didn’t behave exactly as appears on the SPL plot, but the basic physics still apply so it can be a good way to mock something up as long as you make measurements in the field later on.

Show Time
The day of the show came and I was ready. As soon as I got set up and had power running to everything, I was able to get my measurement microphone right in the center of the room a few feet in front of my mix position. I chose this position to align all the low end because I was mixing from there, and the near perfect symmetry allowed the audience to have a similar experience at any seat.
To begin, I convinced Aaron to flatten out the gain and overdrive settings on his bass guitar amp. I then used the phase response of that amplifier as time zero and my target for the phase alignment.
The next step was to measure each main one at a time and adjust the APFs so that the low-frequency energy phase responses all aligned with that of my friend’s amp. I got it as close as I could and moved on to the sub. With sub and monitor receiving the same level I used APFs to match their phase responses to the rest of the sources.
After listening, I realized that the subwoofer had a huge extended range and I needed to set up that low-pass filter to cut most everything above 135 Hz or so. I then had to go back and readjust the subwoofer APFs. The range of frequencies where level overlap occurred was about 40 Hz to 90 Hz. This bit of optimization was all that I had time for – sometimes you do what you can and move on.
Figure 4 depicts the phase traces with APFs on the mains at 40 and 80 Hz with a bandwidth of 1/4- and 1/2-octave and a single APF on the subwoofer at 70 Hz with a 1/2-octave BW.

The APFs pushed the 80 Hz and up range of the mains (blue and green) earlier in phase and delta between it and the bass amp (red) is within a few degrees which means there is summation. Below 80 Hz, the mains were pushed later in phase to match the slope of the bass amp more closely.
If there had been more time, I would have added another narrow APF to try to get closer in phase. The sub (yellow) was pushed closer to the slope of the bass amp than it was in its native state. Most of the low end was within 60 degrees, which will produce summation acoustically. As you can see, all the sources have very similar slopes which makes optimization quite a bit easier.
Overall, I was really happy with how it sounded and when Aaron’s band played they rocked the house. The low end was tight and controlled and had good even coverage throughout the hall. Remember how important aligning low end is – especially in a place of that size, the low “E” on the guitar is 40 Hz, and with all the amps and PA running wide open, 40 Hz is loud. Further, the room is only 2.5 times a single repetition (wavelength) at that frequency. It really needs to be managed!

