
I was working on some array predictions and wondered just how close “like” loudspeakers are in response.
To find out I rounded up some loudspeaker pairs from the warehouse to do some comparisons.
I limited the test to loudspeakers that could be measured up close and personal – within a couple of meters.
This would minimize any errors due to aiming and the environment.
I also looked at the magnitude of the frequency response only, as the phase response will be ultra sensitive to distance errors, and one cannot be sure if a phase slope difference is due to the loudspeaker placement or tolerance issues within the loudspeaker itself.
I felt it was cheating to use the phase plot to “position” the loudspeaker so I decided to ignore phase altogether.
Arta software was used for the comparisons, and the procedure I used was as follows:
1. Measure the axial IR of one loudspeaker.
2. Save this response as an overlay.
3. Measure the second loudspeaker.
4. “Subtract from overlay” to yield the difference.
The mic was not touched between measurements. The loudspeakers were placed as close as possible to the same position – marked with gaff tape.
A time window was used to isolate the direct field. Arta displays a marker that identifies the low frequency cut-off due to the window size.
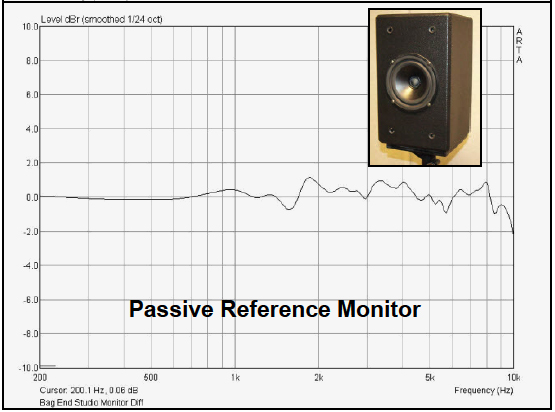
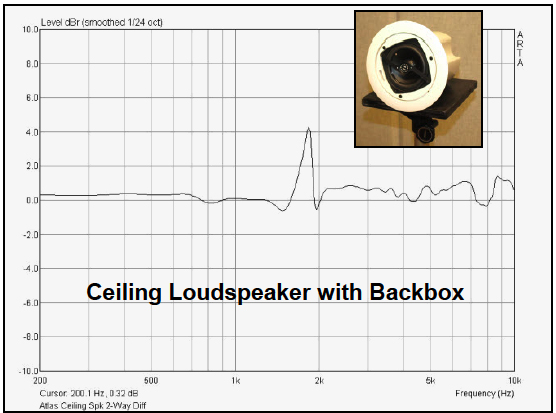
The plots shown here are not the frequency response magnitudes of the loudspeakers. Instead, they represent the difference between the two units tested.
If two loudspeakers were perfectly matched, the plot would be a flat line. The data was smoothed at 1/24th-octave.
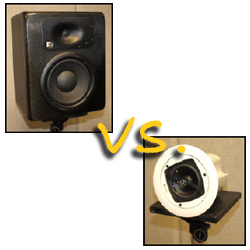
The units tested included 3 pairs of 2-way studio monitors, a pair of ceiling loudspeakers and a pair of general purpose 2-way foreground music loudspeakers. A sixth pair was tested, but the difference was so large that I concluded that something was wrong with one or both of them.
The small size and lack of aggressive horn-loading would be expected to produce better correlation between pairs than large-format devices, with their attendant steep crossovers, aggressive pattern control and greater required measurement distance.

The differentials were within a couple of dB over most of the spectrum, and up to 5 dB at crossover.
This illustrates nicely the role of equalization in the calibration of sound systems, as some of the differences could be eliminated with inverse- filtering using IIR or analog minimum phase filters.
A second lesson from the comparison study is that loudspeakers are individuals, even if they are the same model. One can be measured to the nth degree, but doing so only correctly characterizes that device.
A corrective equalization curve will be unique for a given loudspeaker, depending on the desired accuracy.

One could make an argument for marketing matched pairs of loudspeakers for critical applications, complete with individual corrective EQ curves (as is done to match microphone capsules).
If 2 dB were used as an acceptable tolerance for a matched pair, then most of these pairs would be rejected.
These differences are not an indictment against the loudspeakers tested. Instead they are a reality check regarding the general expectation level concerning loudspeakers, loudspeaker data and the perception of sound in general.

We work in an industry where 3 dB is both a large and a small error – large in that it represents a 2-to-1 power ratio, but small in that it is not a major loudness difference.
While studies like this one are at first sobering, the benefit is that they mold a realistic expectation level when considering loudspeaker accuracy.
It’s better to understand that no two loudspeakers are alike than to assume that they are and then operate on that assumption.