
In Part 2 of this article, the concept and application of the acoustic feedback gain margin was discussed. This concept is helpful for the following sections where the system closed loop performance is examined. Closed loop performance is important as it directly relates to the actual performance of the sound reinforcement system.
In a live sound environment, sound engineers would like to operate as far away from the acoustic feedback point as practically possible. But just how far away should we need to operate from the onset of acoustic feedback? Technically, this question translates to how much acoustic feedback gain margin is required for a reasonable closed loop performance.
Answering the above question calls for a detailed study to be conducted to relate the sound reinforcement system closed loop performance against various arbitrary levels of acoustic feedback gain margins.
The Setup
For improved simulated measurement accuracy, the use of acoustical devices such as microphones and loudspeakers were avoided altogether. Instead, only hardware electronics were involved in this study.
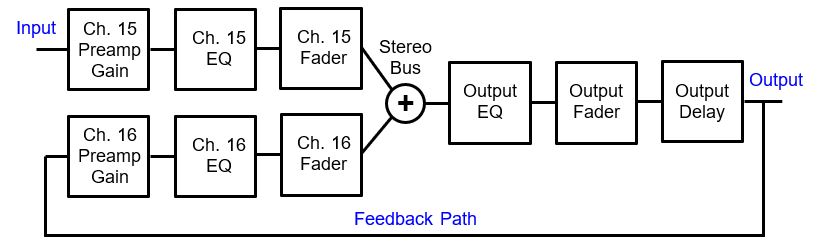
To simulate a typical sound reinforcement system with the associated feedback path like Figure 2 of Part 1 of this article, a digital mixer is utilized where one of the stereo outputs was connected back to another mixer input channel to simulate the acoustic feedback path. An example of such a connection is shown in Figure 17.
Figure 17 can be redrawn to closely resemble Figure 2 of Part 1 of this article and this is shown in Figure 18. From Figure 18, it is clear that Channel 16 equalization can be conveniently utilized to simulate the frequency characteristics of the acoustic feedback path. Likewise, Channel 16 fader or gain can be used to adjust the simulated overall acoustic feedback gain margin.
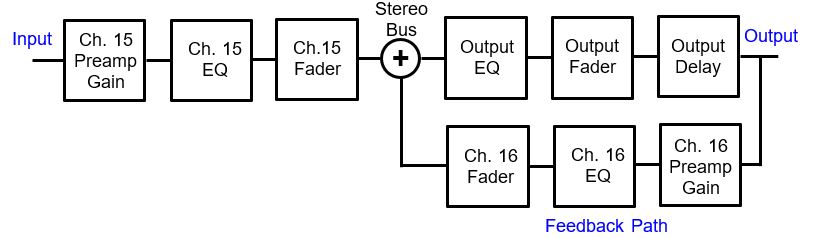
Since this particular mixer model used for this simulation does not have a delay function for its input channel, the mixer output delay is used instead to simulate the distance between the microphone and the loudspeaker. To simulate the distance of about 10 feet between the loudspeaker and the microphone, an overall delay of 10 ms is required. This comprised of the mixer output delay setting of 8.6 ms and the inherent 1.4 ms latency (delay) from the digital mixer.
Channel 15 equalization and the mixer output equalization were kept flat. For a convenient reference on the frequency response plots that would be later obtained from this setup, the gain from Channel 15 input to mixer output was kept to unity (0 dB) by adjusting Channel 15 preamp gain.
Similar open loop gain measurement technique as discussed in Part 2 of this article was adopted to characterize the feedback gain margin of this setup. The feedback loop can be easily activated or removed by unmuting or muting the Channel 16 input. One important thing to note is that with this all hardware electronics approach, the inherent noise in the system is very low and when the loop is closed at or above 0 dB open loop gain, oscillation may not take place. Hence, it becomes difficult to verify if the measured open loop gain of 0dB can result in actual oscillation when the loop is closed.
However, this can easily be overcome by introducing some noise into the system to kick start the oscillation by connecting a microphone to one of the mixer inputs to pick up sufficient ambient noise.
With this setup, it is now possible to study the closed loop performance of the system under various feedback gain margin scenarios. The closed loop performance characterization is obtained by monitoring the transfer function of the output versus the input of Figure 18.
Steady State Measurement Results
The setup open loop response was then tweaked for a feedback gain margin of 6 dB flat across the entire frequency band. Both the open loop and the closed loop magnitude and phase frequency responses are shown in Figure 19. The slight tapering off in the magnitude response at the higher frequency region was contributed by the upper frequency roll off of the digital mixer.
From Figure 19, it can be easily observed that having a hypothetical flat open loop frequency response with 6 dB feedback gain margin had resulted in a wavy closed loop frequency response. Although the wavy closed loop frequency response may look initially surprising, the characteristics of this wavy closed loop response can be explained in the following paragraphs.
Recall that the open loop has a total of 10 ms delay from the digital mixer. Since the loop is feeding back a delayed version of the output back into the input, the first in-phase feedback frequency corresponds to a full cycle delay. The first in-phase frequency can then be calculated by taking the inverse of the 10 ms delay, which is 100 Hz. This explains the first peak of the closed loop response occurring at 100 Hz in Figure 19. Subsequent full cycle delays will also result in closed loop peaks and can be calculated from the following equation:
Fpeak = n/delay where n = 1, 2, 3, 4, 5 ……. (Equation 1)
Similarly the first valley in the closed loop response can be calculated when the half cycle of the feedback frequency corresponds to the 10 ms delay. If the half cycle is 10 ms, then the full cycle will be twice that amount i.e. 20 ms. Hence, the first valley corresponds to 1/(20 ms) which is 50 Hz and this can be verified from Figure 19 as well. In general, valleys occur at consecutive half cycles i.e. 0.5, 1.5, 2.5, 3.5, 4.5 cycles and so on. Hence, the valley frequencies are given by the following equation:
Fvalley = (n-0.5)/(delay) where n = 1, 2, 3, 4, 5 ……. (Equation 2)