
Editor’s Note: The original title of this commentary was “Acoustics 101 for Architects.” The author has recently learned that Acoustics 101® is a registered trademark of Auralex® Acoustics. As such, this commentary, with which Auralex isn’t connected, has been retitled. The actual Auralex Acoustics 101 publication may be accessed here (PDF).
This is installment two in an ongoing series guiding architects, and others, through the world of acoustics. In part one we defined architectural acoustics, explained what sound is, and highlighted the three main types of sound propagation.
This installment introduces two more foundational branches: Section 4 provides an acoustical lexicon that defines some of the most commonly-used terminology. Section 5 focuses on describing and explaining the differences between Echo, Reverberation and Resonance.
This commentary is based on fundamentals and the author’s experience — not perfection. It covers many of the basics, while also exploring several modern and esoteric matters. You will be introduced to interesting and analytical subjects; some you may know, some you may never have considered.
First time readers might ask: Why offer this to the pro audio community when the target audience is architects? The simple answers: Most pro audio practitioners have to work in acoustic environments that are out of their control because of past decisions made by an architect or owner. Also consider: There are probably many new and veteran sound techs that have yet to accumulate a solid acoustical foundation. Most certainly, there are knowledge gaps on both sides of the designer/user relationship. When opportunities arise, this material will help almost everyone to better understand and discuss acoustics.
Note – Because of its scope and length, this commentary is being serialized over the course of many issues. It’s a good idea to start from the beginning, as each new installment builds on its predecessors. For example: The Section, reference, figure numbers, and acronyms cited in each publication continue from the previous issues.
4.0 Acoustical Lexicon
4.1 There are hundreds of unique words, phrases, and acronyms in the acoustical lexicon. It’s not necessary for architects to know or understand most of them. However, there are a few that are essential and widely used, therefore the architectural community should have a basic understanding of their meaning and applications.
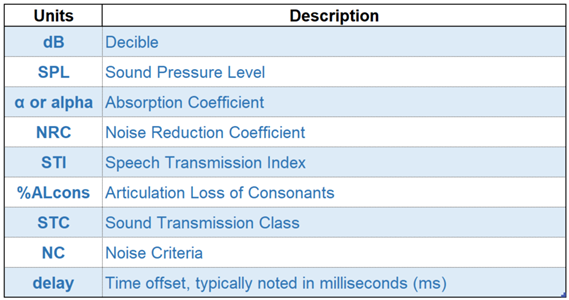
A. Along with their acronyms, Greek letters, and symbols, they are: decibel (dB); sound pressure level (SPL); absorption coefficient (α or alpha); noise; noise reduction coefficient (NRC); speech transmission index (STI); articulation loss of consonants (%ALcons); sound transmission class (STC); noise criteria (NC); and delay. (Figure 6)
B. Add to the list: Echo, Reverberation, and Resonance. Because these three are possibly the most important to grasp and understand, they are presented in more detail in Section 5 below.
C. It’s not necessary to memorize the details. Just be aware they exist, and how they fit into most acoustical conversations.
4.2 The decibel (dB) is a relative unit of measurement that is widely used in audio and acoustics. The dB is a logarithmic ratio of the difference between two values, or a measured value and a reference (threshold) value of 0 dB. [2]
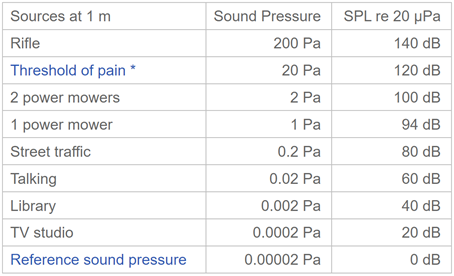
4.3 SPL is the acronym for sound pressure level, measured in dB. The threshold of human hearing has a reference sound pressure of 0.00002 pascals, which is equal to 0 dB SPL. This is the threshold of hearing, in air, at 1 kHz. [2]
A. Decibels are used to compress the immense range of pascals (Pa) we can hear into manageable numbers. Pascals are a unit of pressure. (Figure 7)
B. SPL is a sound field quantity and uses the 20 log factor so, as a rule of thumb:
1. 6 dB = a sound that is generally perceived to be about half again louder or softer.
2. 10 dB = a sound that is generally perceived to be about twice or half as loud.
3. 20 dB = a sound that is generally perceived to be about four times as loud or soft.
4.4 The absorption coefficient characterizes the fraction or percentage of sound energy absorbed – per square foot or square meter – by any given material. Expressed as a frequency-dependent value (alpha or α) between 1.0 = perfect absorption (no reflection), and 0 = zero absorption (total reflection). The values for each material varies with frequency, angle of incidence, and mounting method. The alpha values for each material are determined experimentally.
A. One square foot of 100% sound absorbing material has a value of 1 imperial sabin.
B. One square meter of 100% sound absorbing material has a value of 1 metric sabin.
C. Note: The historical understanding that the absorption coefficient defined above is limited to a maximum value of 1.0 is currently being challenged. Laboratory research has been ongoing for about ten years, with a goal to establish and publish a new ISO standard. If successful, it will eventually replace the ubiquitous absorption coefficient with a more accurate absorption constant. The absorption constant will factor in the additional “edge effect” absorption values that are caused by refraction of sound energy onto an absorptive material. [3]
D. The sabin is a unit of sound absorption, and an application subset of the absorption coefficient. When evaluating a comprehensive acoustic treatment plan, sabins are used to calculate the total absorption provided by all the various treatment materials being installed. Put into context: a 10 ft2 piece of material, which has an alpha of 0.70 at 1 kHz, will provide 7.00 sabins of absorption at 1 kHz.
4.5 Noise is any undesired sound that is audible to the recipient. All sounds that are not productively contributing to the desired program content are noise. Examples: coughing, sneezing, crying, HVAC turbulence or whistles, electrical hums or buzzes, aircraft, highway, train, trolley, industrial, commercial, and/or other loud, in-house activities.
A. Discrete echoes, and excess reverberation, are noise too.
4.6 The noise reduction coefficient (NRC) is a single number value ranging from 0.0 to 1.0. It describes the average sound absorption performance of a material [across the sound spectrum associated with speech]. An NRC of 0.0 indicates the object does not attenuate mid-band sounds, but rather reflects sound energy. Conversely, an NRC of 1.0 indicates that the material provides 100% absorption [of mid-frequency sounds] for an acoustic surface area (in units sabin) that is equivalent to its physical, two-dimensional surface area. [4]
A. NRC is the average of the absorption coefficients, for a specific material and mounting condition, determined at the octave band center frequencies of 250, 500, 1,000 and 2,000 Hz.
B. Note: Because it averages a limited number of octaves, NRC is the least useful metric for any meaningful acoustical analysis, or treatment, which involves music or other low frequency (LF) content.
4.7 Speech Transmission Index and Articulation Loss of Consonants (STI and %ALcons).
A. The understanding of speech (speech intelligibility) is directly dependent on the background noise level; the reverberation time in a room; and the size of the room. For rating the understanding of speech, we have different methods, where STI and %ALcons are established. [5]
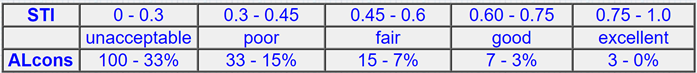
1. STI is a machine measurement of intelligibility whose value varies from 0 (Completely unintelligible) to 1 (perfect intelligibility). STI must be measured in situ, and cannot be predictively calculated.
2. %ALcons expresses the loss of consonant definition, and can be predictively-calculated during the design process. Lower scores are associated with greater intelligibility. Zero %ALcons indicates perfect clarity. For learning environments, a loss of 5% or less is desired.
a. The loss or confusion of the consonants contained in the words we hear leads to poor speech intelligibility. The primary causes of poor or unacceptable intelligibility is excess ambient noise and/or reverberation.
B. STI and %ALcons basically communicate the same information, just calculated and expressed differently. (Figure 8) When properly applied, either are applicable.
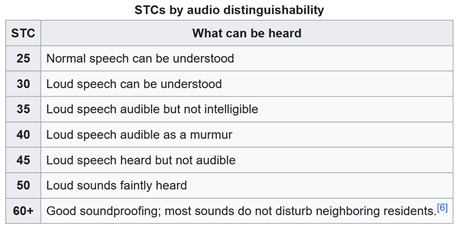
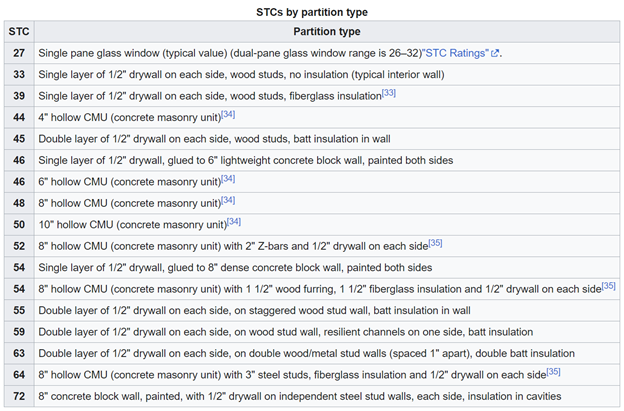
4.8 The Sound Transmission Class (STC) is an integer rating of how well a building partition attenuates airborne sound. (Figure 9) In the US, it is widely used to rate interior partitions, ceilings, floors, doors, windows, and exterior wall configurations. Outside the US, the ISO Sound Reduction Index (SRI) is used. The STC rating very roughly reflects the decibel reduction of noise that a partition can provide. (Figure 10) The STC is useful for evaluating annoyance due to speech sounds, but not music or machinery noise, as these sources contain more LF energy than speech. [6]
A. STC and NRC are different rating systems. They are easily and often confused by many.
1. The STC rating is used to evaluate the amount of sound that can be blocked by a material or assembly. Use this when evaluating partitions or walls meant to block sounds between rooms.
2. NRC Ratings tell us how much mid-band sound is being absorbed by a given material. Use this when evaluating products meant to help improve speech intelligibility or reduce reverberation time in a room.
3. Achieving a desired STC or NRC score for one of these alone does not mean you will achieve a good result in the other; they are mutually exclusive.
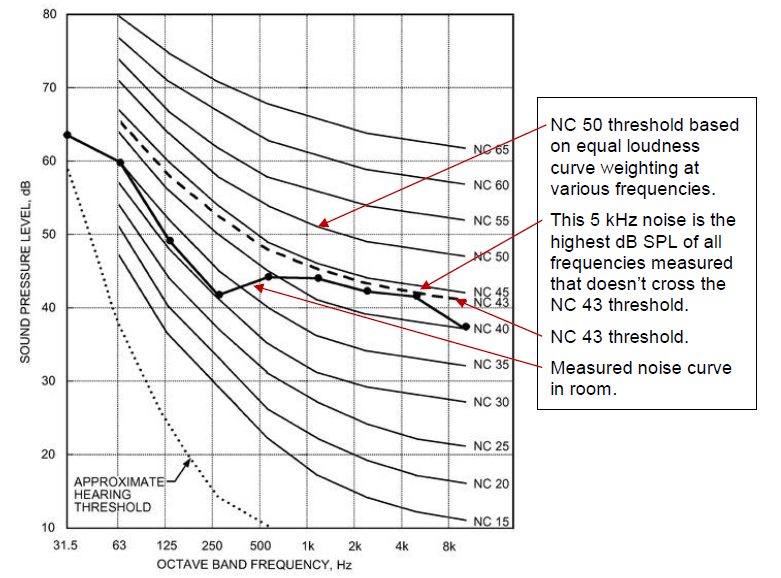
4.9 Noise Criteria (NC) is a single number for rating the ambient noise levels in a room. It was developed in the USA in the 1950s, and is used extensively by the HVAC industry to test the background noise levels in offices, etc. The measured octave bands are compared with NC Curves, which are based on the generalized average sensitivities for human hearing, aka the equal loudness curves. The NC rating is the value of the highest NC curve line touched by the measured noise spectrum. (Figure 11)
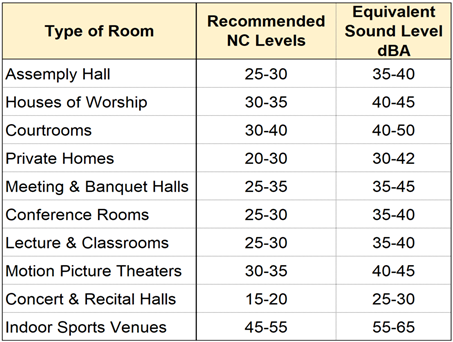
A. (Figure 12) shows examples of the generally recognized NC and dBA targets for various common venues.
1. dBA means that an “A-weighted” filter has been applied to instrument-measured sound levels (dB) in an effort to account for the relative loudness perceived by the human ear. This is done because the ear is less sensitive to low frequency sounds.
4.10 Delay: As covered in Section 2.5.C, the speed of sound is very slow, especially when compared to the speed of light. This is significant because unsynchronized sounds, i.e. identical sounds that are separated by a delay of about 30 ms (milliseconds) or more, are heard as separate sounds. This is problematic for many reasons. The longer the delay, the more noticeable and problematic it becomes.
A. For most people, the ear/brain system is able to integrate delays that are less than about 30 ms, therefore, very short delays (< 30 ms) are indistinguishable from the original sounds, and can usually be beneficial.
B. A fairly common example of problematic delay occurs when talking on a cell phone. Hearing your own voice come back to you – a fraction of a second after you have said something – is a nearly identical, delayed sound.
C. In medium and large rooms, a common example is caused when one or more point source loudspeakers are installed throughout a room to provide coverage in areas that the main loudspeakers cannot adequately reach. The need for such secondary “fill” loudspeakers is generally due to distance, obstructions, and/or for asymmetrical or atypical seating layouts. All fill loudspeakers need to be carefully time-aligned (synchronized) to eliminate any perceived delays.
1. When necessary, and done properly, additional fill loudspeakers add significant cost to an audio system. Mirror image seating symmetry along the center line of the room – i.e. equal in size, shape, finishes, elevation, and distance from the stage, platform or desired sound source – generally minimize the number of fill loudspeakers required.
D. Worst case scenario: Unsynchronized loudspeaker delays deployed in a room with unmanaged echo, and excess reverberation. With reasonable accuracy, all these can be pre-determined using the %ALcons calculations.