When measuring an electrical voltage signal, like pink noise at the output of an analog mixing console, the mixer’s electronics have very little propagation delay.
Electrical signals on an RTA display will very closely match what 3-D FFTs display. This is because electronics do not time-smear the original signal. Therefore, if an electrical pink-noise signal is flat on an RTA, it will also be flat on a 3-D measurement system as well.
However, once an electrical signal is converted by a loudspeaker to an acoustical one and reflected around a room, the time smear is substantial. All the energy is not present at the same point in space at a single point in time, nor is it all dispersed from the speaker uniformly with respect to frequency.
The direct sound signal that travels straight from a loudspeaker to a measurement mic will be the shortest path and travel time between the two. Energy that first reflects off a side wall, then a back wall, then the floor, then to the mic, will take many milliseconds more. This later energy appears to arrive simultaneously with the direct sound on an RTA display and will be summed with it.
However, this reflected energy can be ignored by the display of a 3-D measurement system, and it is this characteristic that makes it a superior measurement system.
If you equalize a loudspeaker to be flat on an RTA display with the measurement mic in the middle of the listening area, you’ll be unpleasantly surprised by the resulting bad sound quality. This is not a similar measurement to the electrical one by any means.

Types Of Curves
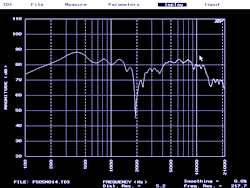
Probably the first person to recognize this difference was Dr. Charles Boner, the godfather of audio consultants who was one the first to practice equalization. He developed what has been called the ideal-room curve or preferred-listening curve. It’s largely the acoustical power response of the loudspeaker system, as modified by air and surface absorption within the room (Figure 1).
What is the power response of a loudspeaker system? Other than being one of the most over-used and least-understood terms used today in audio, it is the sum total acoustic power that a loudspeaker produces.
For example, let’s measure a two-way loudspeaker system in a large room, with the measurement mic in front of the speaker in the middle of the listening area, in the reverberant field beyond critical distance, where the direct sound is lower in level than the reverberant field energy.
Most of the high-frequency energy is aimed in the general direction of the mic due to the directional effect of a horn on the high-frequency (HF) driver.