
Recently I was involved with an event featuring onstage puppetry with some unique technical challenges. The production was originally staged in a small black box theater with carefully controlled sightlines. Adapting the touring version of the production to our 700-seat theater required an out-of-the-box approach – or more literally, an in-the-box approach.
The audience was seated on the stage on risers, and the stage right wings became the performance area, with a grid rigged overhead for sound and lighting. The grid was surrounded on all four sides by theatrical soft goods to mask off a box, leaving only a small proscenium-like opening in the front where the performance would take place.
The rest of the “box” was filled with lighting and audio equipment. The sound system was an 8-channel spatial rig, designed to create the perception of sound cues coming from various locations throughout the performance area.
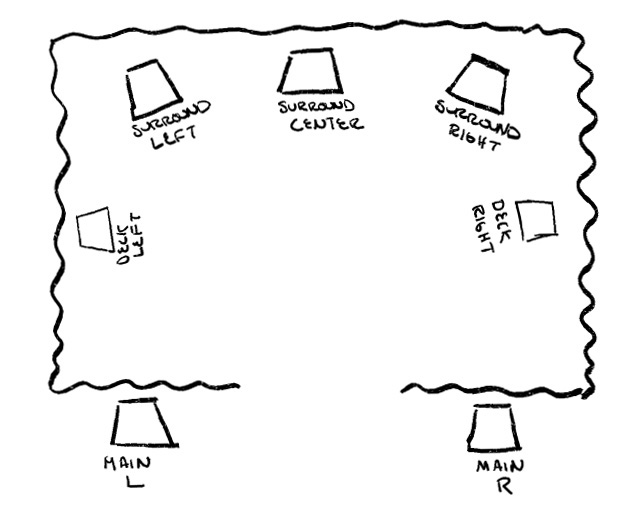
In addition to a standard flown left/right (L/R) point source pair for mains, there were another three boxes flown across the upstage edge of the area in a left-center-right configuration (I will refer to these as the “surrounds” for lack of a better term). There were also a pair of side fills on the deck, firing across the performance area, and a pair of 18-inch subwoofers placed under the audience seating area.
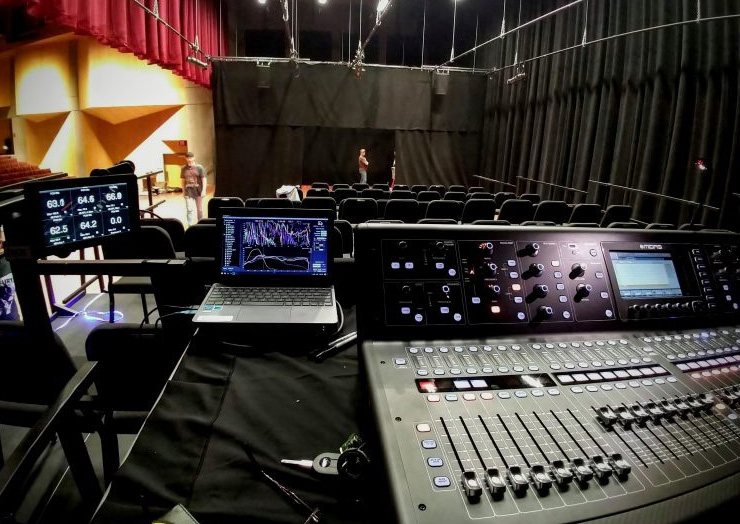
The show’s technical documentation organized the system into three stereo pairs: main L/R, surrounds L/R, and deck L/R, plus the surround center and the subwoofers, which makes eight channels in all (Figure 1). They were driven from an 8-output QLab file that travels with the show. My job was to arrange and optimize the system ahead of time.
Since I wasn’t familiar with the specifics of the production or the design, I had to make some educated guesses in terms of the tuning. My approach was to get the entire rig functioning and tuned to a neutral baseline, with the levels approximately balanced when measured from the middle of the audience area. From there, the production’s sound designer could move forward and modify that as desired.
Main L/R
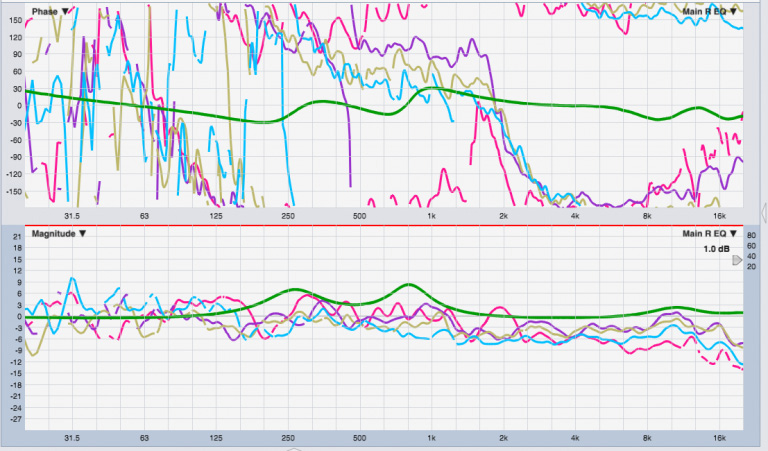
I tuned this pair much like I’d tune any L/R pair in a theatrical context. I started by measuring the left side on-axis at three positions from the front to back of the performance area (Figure 2).
We can see an important principle at work here: we aim at the furthest seat, and as we move forward in the seating area, we are gaining level due to proximity but losing it axially. Ideally we offset the two and end up with a minimum variance situation. Note the consistency above 1 kHz in the above traces.
The pink trace is taken in the last row and has the flattest response, and the lowest level (furthest away). The dark red trace is taken in the first row of seats, which is closer (louder) but also far off-axis vertically, so we see a significant high-frequency rolloff. The middle trace (mint green) splits the difference. Since the loudspeaker loses directivity below 1 kHz (when the output transitions to the woofer), we see simple gains as we get closer due to proximity – axial losses in this lower frequency range are negligible.
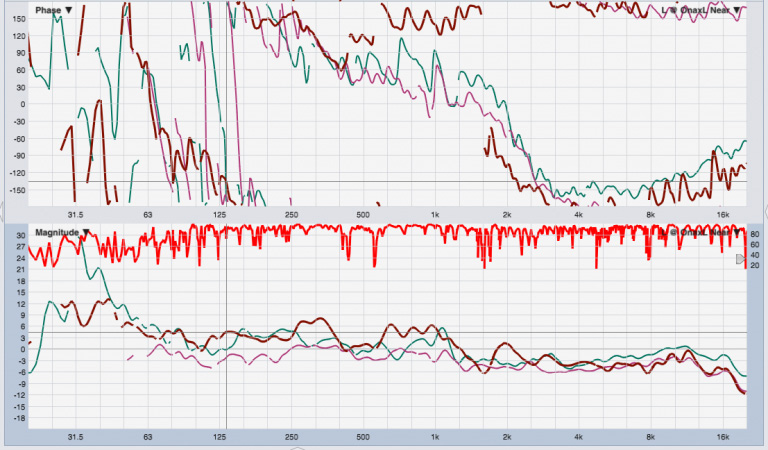
It’s a point source so we need to pick a single EQ solution that’s a best fit. Figure 3 is an average created from the three traces in black, the inverted EQ (1/EQ) trace in green, and the result in red. The seating area is a series of decking in stepped heights so we must be cautious of strange ground reflections here, and I ended up reducing the 300 Hz cut a bit after taking this measurement.
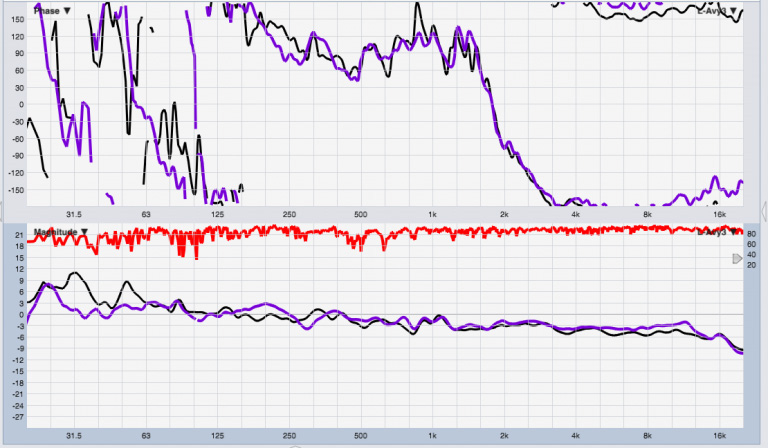
The process is repeated for the right side, and I’ll show it via an “optical average” this time rather than have the analyzer do it (Figure 4). Here we can see that the EQ cut at 280 or so is placed a bit too low for the bump in the response around 315, so I moved that up after taking these measurements.
Let’s look at the match between the final L and R average responses (Figure 5). I’m not concerned with the response below 63 Hz or so – that’s mostly environmental noise in the measurement, as indicated by the lower coherence. (Since it’s an average, the coherence is a bit higher than it is for the individual traces.)
Surround L/R
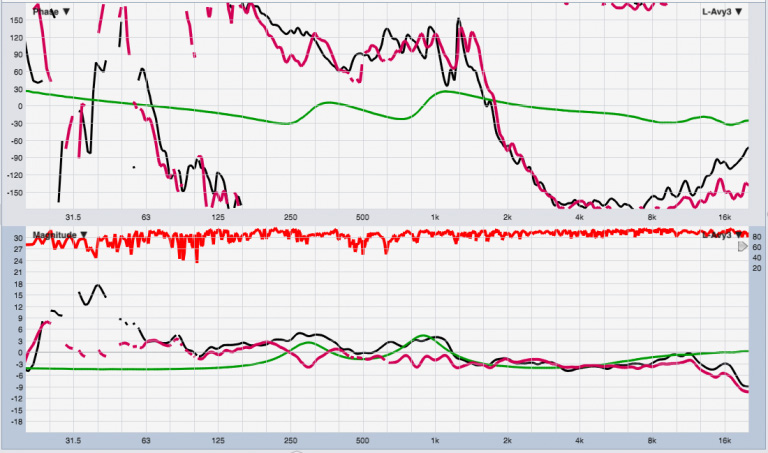
Now we move on to the flown L/R surround pair. These sources do not have a direct line of sight to the audience seating due to the masking drapery. Matching the HF response of the mains via immense HF boost is obviously inadvisable, so my plan is to make sure that the pair is symmetrical (match each other in tone and level). I measured from the center seat of the front row, but any position equidistant from the two should suffice.
In Figure 6, we can see the stage left box (maroon trace) has a significant level advantage. This could be because the other side has a cabling issue (lost a leg on the XLR) or because the level pots on the back of the boxes got bumped after I set them.

Since the rig is up in the air, I opted to simply adjust the level of that output at the console until they matched. If further issues crop up, time to get out the Genie lift.
How much level offset? In (Rational Acoustics) Smaart, use the Ctrl+ Down Arrow keys to lower the trace until it matches up with the other side. (You can also click and drag the trace up or down directly.) This ended up being 4 dB, which I adjusted at the console output.
There’s a small HF difference but I’m not going to go after that just yet given the environment (I’m measuring amidst Genie lifts and lighting booms).


