
Particle Velocity. The particle velocity (u) is the velocity fluctuation a particle undergoes in the acoustic medium about its equilibrium position resulting from the passage of acoustic pressure. The units are m/s.
Note that the particle velocity should not be confused with the characteristic propagation velocity of sound, 343 milliseconds (ms), which describes the rate at which sound travels through the medium.
One important characteristic of the particle velocity is that it is 90 degrees out of phase with the acoustic pressure when close to a physical boundary or the radiating surface. This characteristic is of prime importance when designing sound absorptive treatments such as “bass” traps. We will examine sound absorption in a future article.
The amplitude of the particle velocity is directly proportional to the acoustic pressure. Acoustic pressure and particle velocity are related to each other by the following equation:
Equation 1:

where,
p = acoustic pressure, Pa
ρo = air density, 1.2 kg/m3
c = velocity of sound, 343 ms
u = particle velocity, ms
The constant term in Equation 1, ρ(o)c, is referred to as the characteristic impedance of the acoustic medium. It is of prime importance in helping us understand the interaction of a vibrating surface, such as a loudspeaker cone, and the surrounding acoustic field that provides a “back pressure” on the radiating surface. This radiation phenomenon will be examined in a future article.
Acoustic Energy Relationships. A sound wave comprises both potential energy and kinetic energy. Potential energy is energy that is stored and is ready to do work. Kinetic energy is the energy of motion.
The sum of the potential and kinetic energies is always constant, assuming a lossless transmission medium, even though each contributes a varying amount depending on the position in the oscillatory cycle.
At the extremes of the oscillatory cycle (maximum positive or maximum negative pressures) the energy is primarily potential with zero kinetic energy. At the mid-point of the oscillatory cycle the energy is primarily kinetic with zero potential energy.
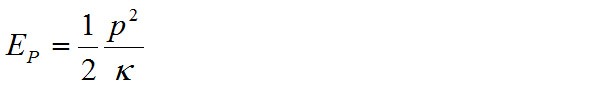
Between these limits there is a combination of potential and kinetic energies. The total energy per unit volume is called the sound energy density. Potential energy density, kinetic energy density, and sound energy density are related to each other by the equations below.
Equation 2:
where,
E(P) = potential energy density, Joules (J)
p = acoustic pressure, Pa
κ = bulk modulus of acoustic fluid, Pa (equal to poc2)
ρo = density of transmission medium, kg/m3
c = speed of sound, 343 ms
The potential energy is directly proportional to the square of the acoustic pressure. The bulk modulus is used to specify the volume decrease of the acoustic medium occurring under uniform pressure. Think of it as the “compressibility” of the acoustic medium.
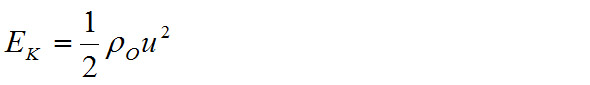
Equation 3:
where,
EK = kinetic energy density, J
ρo = density of transmission medium, kg/m3
u = particle velocity, m/s
The kinetic energy is directly proportional to the square of the particle velocity.
Equation 4:

where,
E = sound energy density, J/m3
EP = potential energy density, J
EK = kinetic energy density, J
ρo = density of transmission medium, kg/m3
u = particle velocity, ms
The sound energy density in the acoustic medium is the sum of the potential and kinetic energies.
Figure 3 illustrates the interaction of the potential and kinetic energies in the form of the Heyser spiral, a representation of the frequency response for a small loudspeaker separated into the real (kinetic energy) and imaginary (potential) energy relationships.
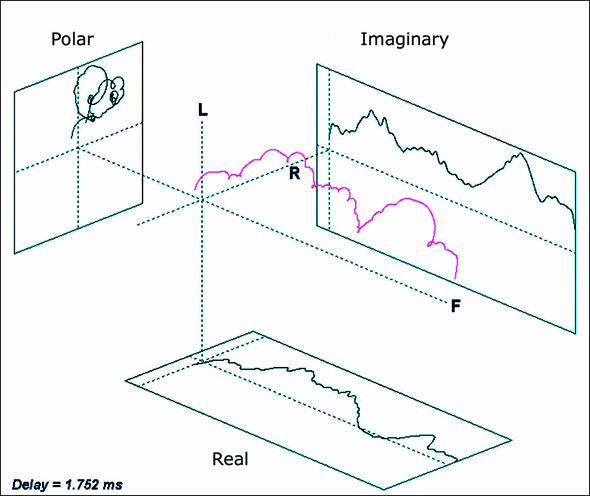
The frequency response of the loudspeaker is shown in the center between the boxes. The real (kinetic energy) response is shown at the bottom and the imaginary (potential energy) response is shown to the right. The figure to the left is the Nyquist (polar) display of both responses.