We’ll use two 4” speakers to get some practice with the phase adjustment procedure.
For our 4” to behave acoustically like our real, full-scale systems, we will need to scale the crossover frequencies up.
To do that we’ll multiply the real system cut-off frequencies by the ratio of the real system to our scaled down box, i.e., we will multiply the cut-off frequencies by 18”/4” = 4.5.
Therefore the cut-off frequencies for the scaled down measurements, which will be entered in the processor for the 4” system, will be as follows:
Cut-off frequencies for the scaled down subwoofer system will be:
- HPF LR24dB/Oct, 30Hz x 4.5 = 135Hz
LPF LR24dB/Oct, 85Hz x 4.5 = 382Hz
The cut-off frequencies for the scaled down mid-high system will be:
- HPF LR24dB/Oct, 50Hz x 4.5 = 225Hz
LPF LR24dB/Oct, 20KHz
We’ll leave the low pass filter for the mid-high box at 20 kHz. Otherwise we would be in the ultrasonic range.
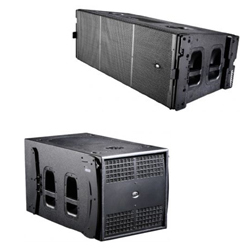
For these measurements we used a DAS Arco 4 enclosure as the subwoofer, lying on its side.
The box used as a mid-high, also a DAS Arco 4, is placed somewhat higher up, and some 15cm (6”) behind the box being used as a subwoofer, as shown in Figure 7.
The microphone is placed on the ground, at 90cm (3 feet) from the simulated subwoofer.

In order to notice more easily the difference between aligning the phases or not aligning them, it is recommended to set the acoustic levels of the mid-high and the subwoofer the same in the band being shared, 225Hz to 382Hz in our exercise.
The procedure is as follows:
1) Enter 20 ms as the delay time for each of the outputs in the processor (This is an arbitrary value; a different delay time can be used).
2) Let’s first work just with the mid-high. We’ll use the “Delay Finder” utility to add the required delay to the channel with the reference signal, i.e., to synchronise the reference signal to the measured signal. (See the user’s manual for SATlive or your analysis software for more information).

3) Measure the magnitude frequency response for the complete system before doing phase adjustments. At worst, we will see significant cancellation in the frequency range being shared by both enclosures. The measurement can be seen in Figure 8.
4) Mute the subwoofer output, and un-mute the mid-high output in the processor.
5) Measure the mid-highs and save the curve. In our example, the curve in Figure 9 is obtained.

6) Mute the mid-highs and un-mute the subwoofer output.
7) Do not use the “Delay Finder” again!!! (i.e., do not synchronize the reference signal to the measured signal again).
Remember that we are comparing phase on both outputs, i.e. we are measuring the difference in time arrival between the two signals as a function of frequency.
Therefore the synchronization delay for the reference signal should not be changed on the measurement software again. Keep in mind that we took the mid-high box as our timing reference because it is the signal from which the best impulse response can be obtained.