In the first part of our series, we took a look at what exactly phase and polarity are, what causes phase to vary, and what is meant by phase alignment.
Coherence Curve
The coherence curve that Fast Fourier Transform based measurement systems provides indicates the probability that the measurement is reliable.
It’s very common to find a coherence curve (ranging from 0 to 1, or from 0% to 100%, depending on the measurement system) with low values in part of the spectrum.
We should not trust the magnitude or phase frequency responses for those bands for which our measurement system shows low coherence.
There are two main reasons for poor coherence:
1) Reference signal is badly synchronized with the measured signal.
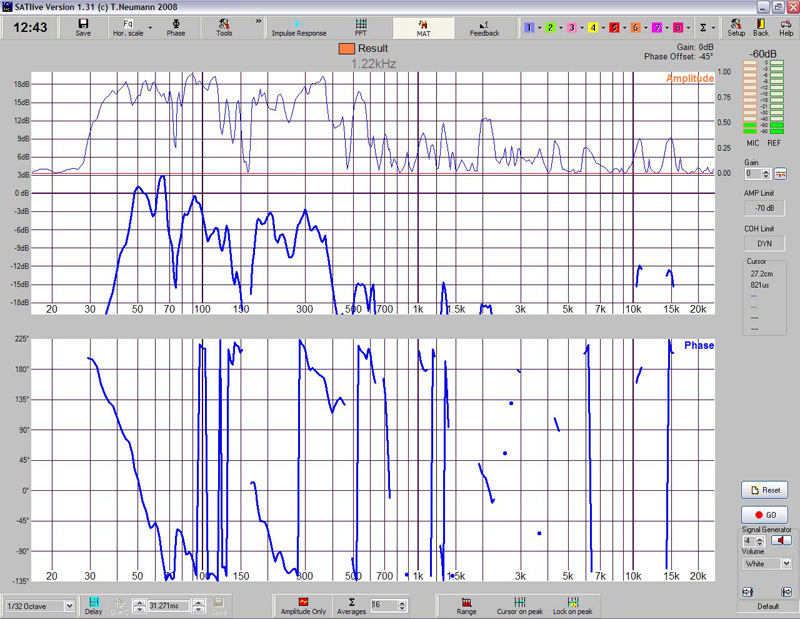
We can test for this easily if we initiate a measurement without having first synchronized the measurement signal using the “Delay Finder” on SATLive or the equivalent function in other systems.
In this case it will be seen that coherence for the high frequencies is very low, as seen in Figure 6.
2) Reflections.
These will cause coherence in some frequency bands to be low. We should not trust measurements on those bands.
If we are interested in measuring a part of the spectrum that has poor coherence, we can change the microphone location.
When it comes to adjusting phase, we should check the coherence in order to know which parts of the measurement are reliable and which ones are contaminated by reflections, reverberation, etc.
Example 1: “Scaled down measurements: the subwoofer and the mid-high box share a frequency band”
Before trying to do these adjustments for the first time in a real-life situation, where one may not always have enough time and where conditions are far from ideal, scaled down measurements can be handy to get some practice with the procedure.
We’ll assume that you already know how to take transfer function measurements with the measurement system you are using, and that the equipment used is adequate.
To synchronize the reference signal to the measurement signal, we need to measure the system’s impulse response, which is better obtained from the high frequency band, and therefore we’ll always use the mid-high units for synchronization.
There will be times when we’ll need to shift the subwoofers backwards by adding delay, and times when we will need to move them “forward” with “negative delay”.
Since such thing does not exist, we’ll add an initial time delay that is the same for all bands, so that we will be able to add or subtract delay from the subwoofers’ initial delay time. Once the system has been adjusted, we’ll get rid of excess delay, as will be seen in the examples.
Let’s now run a scaled down measurement of an 18” subwoofer and a mid-high unit.
Subwoofer cut-off frequencies for the real system will be:
- HPF LR24dB/Oct, 30Hz
LPF LR24dB/Oct, 85Hz
Cut-off frequencies for the real mid-high unit will be:
- HPF LR24dB/Oct, 50Hz
LPF LR24dB/Oct, 20KHz

