EDITOR’S NOTE: This fine article was featured in the March 2004 issue of Live Sound International. We reprint it here in celebration of our 25th anniversary.
How many sound systems are in use? Many millions, for sure, and they’re found in all types of venues and for all kinds of programs.
So one would think we’d know exactly how to do it by now. But there seems to be plenty of examples to prove that we don’t. Why should this be? What is it we don’t yet understand? Do we even know enough to know what we don’t know?
Perhaps we should start by trying to define the characteristics of a good system. Not just “it sounds good” but what—exactly—makes the difference between “good” sound and not so good. Then we might be able to quantify how good each characteristic needs to be and how to judge whether it’s good enough or not.
After more than 40 years spent designing and testing sound systems, I’ve finally come up with a list of the factors that I feel make up what we could call quality in a system, and why. In this installment, I’m going to confine my list and discussion to systems for speech reinforcement only. Next time, we’ll look at factors for music systems.
Reliability
The most important quality factor has to be reliability. No matter how good the performance of a system may be, if it fails to work, it is useless.
Reliability is largely an engineering matter, involving component selection, configuration design, and assembly and installation correctness, for example, but any system can be abused to the point of failure. Significantly, failure may not be abrupt and catastrophic, but instead may take the form of performance decline due to damage.
One particular, and common, example of damage-induced deterioration can be found commonly-used transducer for higher audio frequencies, the horn and compression driver combination. Drivers have a severe amplitude limit; if over driven, the driver diaphragm will impact the phasing plug, an essential part of the structure. If the diaphragm material is metallic, it can fracture and fail.
Some diaphragms, however, are made of a resin-impregnated fabric, which is much less brittle and, therefore, more able to survive a collision with the phasing plug. Repeated collisions, however, still cause progressive deformation (or warping) of the diaphragm, resulting in eventual failure and therefore, progressive decline of the driver’s performance characteristics.
Predicting and detecting this impending failure, however, is not easy to do. The audible change in performance is fairly subtle and can be detected reliably only by careful comparison of the sound of a single questionable driver with that of a known good one. In the field, such a comparison is usually impractical.
Further, a driver that has been used heavily for some time will also exhibit some performance deterioration, even though it has never been over driven into diaphragm collision.
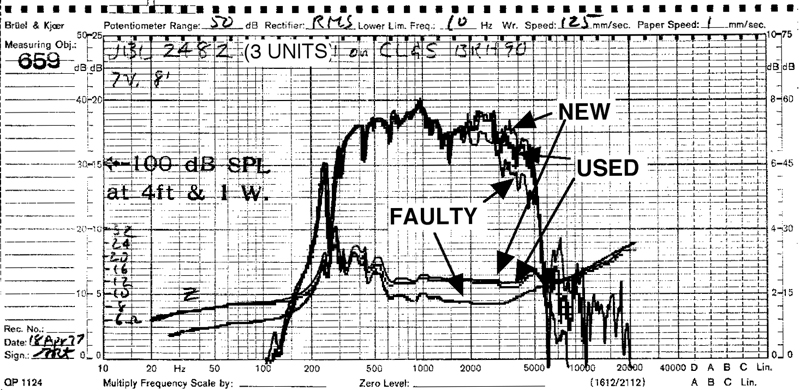
Figure 1 illustrates these performance differences. The frequency response (amplitude versus frequency) of three drivers of the same model (with an impregnated-fabric diaphragm), one new, one well used but apparently undamaged, and one with observable damage.

It can be seen that the response at higher frequencies changes with use or abuse. The differences between the upper two measurements are slight, while the third one is significantly different.
There seems to be a good relationship between the measured and (subjectively) observed performances in cases like these, but no real study of this relationship has been performed.
So it would seem that a response measurement could be a valid substitute for a listening test. In fact, such a relationship has been established under certain circumstances, but not definitively in a sound reinforcement context. An investigation of this relationship would certainly be worthwhile.
However, there is another measurement that is easy to make, even though it’s seldom done. The bottom three curves on Figure 1 represent the measured electrical impedance at the input terminals of each of the three drivers. Such a measurement is usually quite easy to make, even on a driver installed in a system.
It’s apparent that these curves separate the characteristics of the three drivers as well as any other common measurement does, especially in the case of the damaged unit, and much more easily. In fact, automated tests of this type have been designed into integrated systems as performance and reliability checks, with good results.


