In discussions about matching amplifiers to loudspeakers, sooner or later someone will caution that an underpowered amplifier poses a greater risk to the loudspeaker’s welfare than a properly specified one. The usual explanation goes that driving the underpowered amplifier into clipping will generate square waves, which will burn out the loudspeaker’s high-frequency driver due to the additional high-frequency harmonic content.
The idea that underpowered amplifiers are more dangerous than properly specified ones is delightfully counterintuitive, and the appealing explanation does pass a quick “sniff test”: of course, clipping a waveform generates high-frequency harmonics, and of course sending more energy to a high-frequency driver will increase its heating.
The many occurrences of this claim are “variations on a theme,” and one could never hope to definitively address every unique set of circumstances, however, an evaluation of the underlying concepts provides helpful context.
An Obvious Correlation
It is clear to see why so many engineers have come to regard the clipping of an amplifier as a harmful practice. When a system is being pushed past its design capabilities, it is more likely to experience a failure, and it will probably sound distorted before said failure occurs. Thus, the readily audible distortion that occurs when clipping amplifiers can be a reliable indicator of danger.
Experienced operators have justifiably learned to associate the sounds of clipping with the loudspeaker damage that so often followed. The common sequence of events is straightforward: amplifiers are clipped, the system sounds distorted, then fails. It is easy to conclude, based on the empirical evidence, that it was the distorted signal itself that caused the failure. But is the distortion the true cause, or simply just a correlation? If the latter, what is the true culprit?
History & Literature
Since a modern professional loudspeaker is either self-powered via an internal amplifier, or paired with a proper amplifier and preset by the manufacturer, the underpowered-amplifier issue (referred to herein as the “Low Power Danger” claim) might be viewed as little more than a historical interest, along with vacuum tubes and carbon microphones. However, the claim has exhibited an almost vampirical ability to keep resurrecting itself. This seems to be, at least in part, due to its inclusion in several well-respected audio resources.
The Electro-Voice EV PA Bible (reference 1), written in 1979, offers the following caution on page 2: “This amplifier clipping is also a common cause of loudspeaker failure. When clipping occurs, high-level high frequencies are produced which usually overpower tweeters and midrange speakers and result in smoke and no sound!”
JBL Professional dedicates an entire TechNote (2) document to the topic as well: “We occasionally hear of loudspeaker owners who damage the high frequency components of their loudspeaker systems using amplifiers that are rated at less – rather than more – power output than recommended. Understandably, they may wonder how it is that such an amplifier can actually burn out components when the loudspeaker system is rated to handle larger amounts of power. The loudspeaker’s specifications are true, provided the amplifier is not overdriven. But that’s a very important caveat – not overdriving the amplifier. Driving an amplifier too hard in order to get higher sound level from it (whether perceived or real) can damage some components – especially the high frequency components.”
The same TechNote goes on to state: “The additional power generated by overdriving the amplifier is rich in harmonic (distortion). In a passive (non-powered) full-range speaker, these harmonics get routed by the crossover network to the high frequency driver. Harmonics are higher frequency multiples of the original signal. Therefore, the high frequency component of a loudspeaker system must bear the brunt of the distortion – even though the original signal may be at a lower frequency.
“[W]hen an amplifier is overdriven, the contours of the wave are ‘clipped’ off, producing a near square wave, having flat areas at the top and bottom limits.
“The average power approaches the peak power. When this occurs, up to twice the amplifier’s rated output can be delivered, and much of that extra power is from harmonic distortion, which get routed by the loudspeaker’s crossover network to the high frequency driver(s), which may not be capable of handling the abnormally high level of power.”
The Yamaha Sound Reinforcement Handbook (3) elaborates on page 202: “Clipping has two basic effects. Obviously, it greatly increases the distortion. This results in the generation of high frequency components that lend a very harsh quality to the sound, and may endanger high frequency drivers – particularly in passive crossover systems. More important, clipping dramatically increases the average power applied to the load, which can overheat voice coils.”
The cumulative effect of these and other publications offering the Low Power Danger claim has been sufficient to entrench it as fact for several generations of audio engineers. On its face, it seems so straightforward (clip a sine wave, get a square wave, harmonics burn out high frequency driver) as not even to require empirical testing or mathematical deconstruction. The authors posit, however, that it is because the widely accepted explanation is so seemingly logical that the Low Power Danger claim has evaded a more rigorous re-evaluation in the court of conventional audio wisdom.
That is not to say that attempts haven’t been made. In an article appearing in the September 1973 issue of Stereo Review (4), Roy Allison records that the Low Power Danger claim was already well established by the early 1970s: “It has often been pointed out that an overdriven amplifier clipping off the extremes of the original waveform generates harmonic-distortion components of the input signal. That is certainly true. Further, it has been observed that this spurious-harmonic power is likely to fall into the tweeter range (also true), thereby increasing the probability of tweeter failure by adding to the average power it must dissipate. It is therefore usually concluded that, because of the shift of power into the high frequencies, an overdriven low-power amplifier is more dangerous to your tweeter’s health than a higher-power amplifier capable of handling the same input signal without clipping its output.”
Enthusiastic hyphenation aside, Allison calls this an “unwarranted conclusion in many practical cases” before reminding us that the harmonics of a square wave contain very little power indeed.
This fact was illustrated again in 1991 by Monty Ross in RaneNote 128: Power Amplifier Clipping and its Effects on Loudspeaker Reliability (5). Ross reminds us that about 90 percent of the power in a square wave is contained within the fundamental frequency, so clipping a sine wave does shift some amount of energy higher into the spectrum – just not as much as one might think.
Do Square Waves Contain DC?
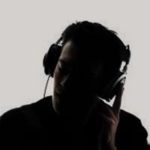
It is often claimed that the flat tops of a square waveform are due to the presence of DC. This is not the case. The mathematical formula for a square wave is a fundamental sine wave frequency plus odd harmonics in decreasing amounts. The amplitude of each harmonic N is equal to 1/N. In other words, if the fundamental frequency has an amplitude of 1, the third harmonic has an amplitude of 1/3, the fifth harmonic has an amplitude of 1/5, and so on. Figure 1 shows an example of a fundamental frequency f and the first two harmonics in the series, 3f and 5f, as well as the summed waveform in red.
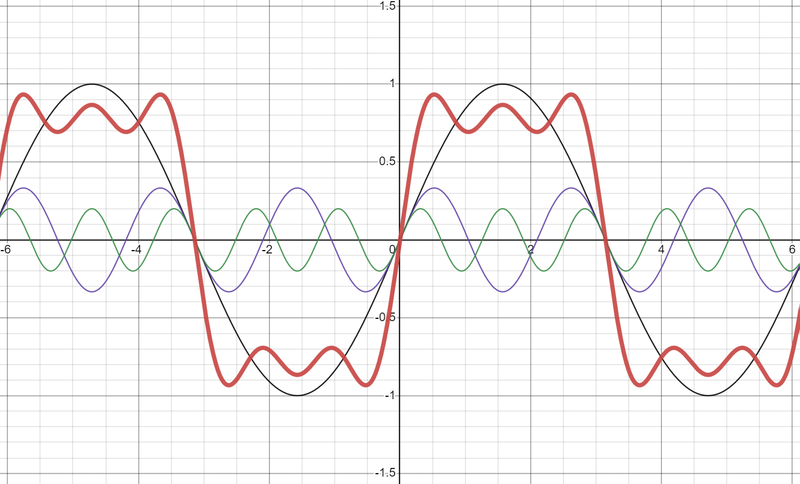
Through the addition of extended high frequency harmonics, the waveform becomes “flat.” Figure 2 shows the result of summing the fundamental with the first 10 odd harmonics, producing what now resembles a square wave. Further inclusion of higher frequency harmonics will increasingly “square” the waveform.
One conclusion we can draw from this is that most of the power content in a square wave lies in the fundamental frequency – just about 90 percent as Ross points out. The third harmonic, at an amplitude of 1/3, is already -10 dB, and the higher harmonics are lower still.
Since the waveform is vertically symmetrical around zero, there is no DC component. If DC were present in the signal, the entire waveform would be vertically offset either above or below the central axis, and a Fourier transform would then reveal a non-zero DC component.
If the clipping harmonics themselves don’t contain enough power to overheat the driver, what’s causing it? According to Ross, it’s increased heat because the operator turned up the system. Turn up a sound system until it is tickling its limiters – then keep going. If you’ve pushed 6 dB past that, you’re now 6 dB into clipping – and you’ve also increased the power delivered to the drivers by a factor of 4, along with a corresponding production of heat.
This also rather conveniently explains why a bi-amplified system can also be destroyed by being run too hard, even though the high-frequency driver is isolated from the low frequency amplifier’s clipping harmonics, something that the “death by harmonics” theory could never adequately explain.
Given the previous, one of the authors has found a hobby of conducting an ongoing, informal poll among friends and colleagues – have people heard the Low Power Danger claim? (Virtually all said yes). Did they believe it to be true? Only about half did, and the division was interesting: although well-accepted as fact by so many boots-on-the-ground working sound engineers, the claim was roundly dismissed by those who work in amplifier and loudspeaker design. Clearly a deeper investigation is in order.
Square Waves & Phase
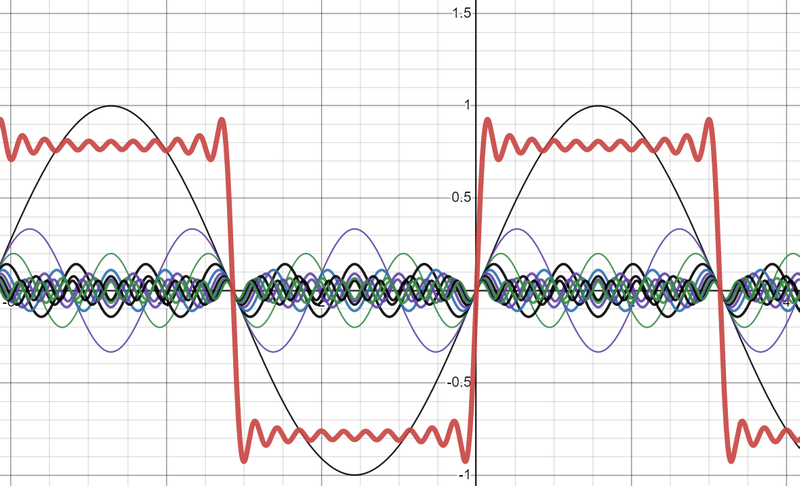
Another point to ponder is that the flat waveform is the result of a specific phase relationship between the fundamental and all the harmonics. If that relationship is disturbed by phase shift, the waveform no longer exhibits “flatness.” In Figure 3, a random phase offset has been applied to each harmonic, eliminating the flat portions of the waveform.
Once a square wave is exposed to any filtering in the signal path, the resulting phase shift ensures that the square wave is no longer square – even if the magnitude effects of the filter lie below the fundamental frequency of the square wave.
The waveform at the top of Figure 4 shows a 250 Hz square wave generated in audio software Audacity. The bottom of the figure shows the effects of applying a fourth order high pass filter at 150 Hz. Although the filter’s magnitude effects lie well below the fundamental, the filter’s phase shift is sufficient to disrupt the relationship between the frequency components enough to distort the shape.
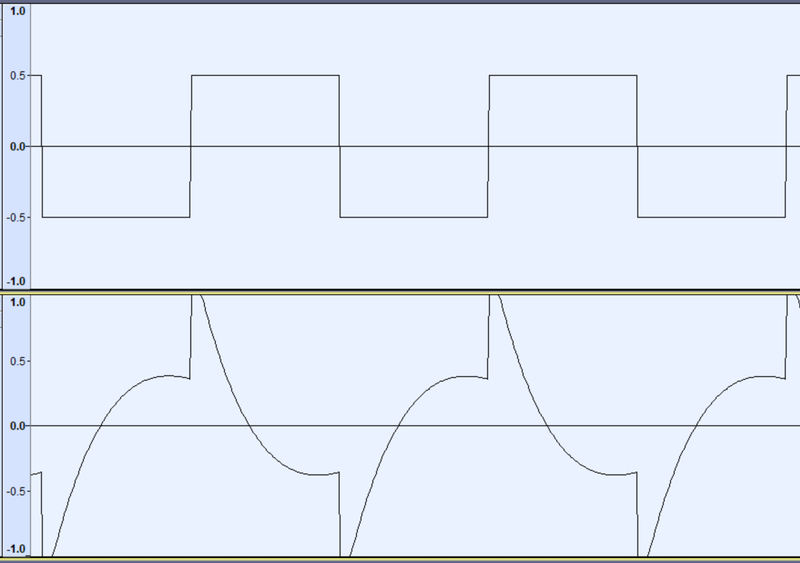
Figure 5 provides the result of measuring the software’s high-pass filter directly with a dual-channel audio analyzer. We can see that the filter’s magnitude response has no effect on the square wave’s frequency components, but the filter’s phase shift extends about 5 octaves above the corner frequency.
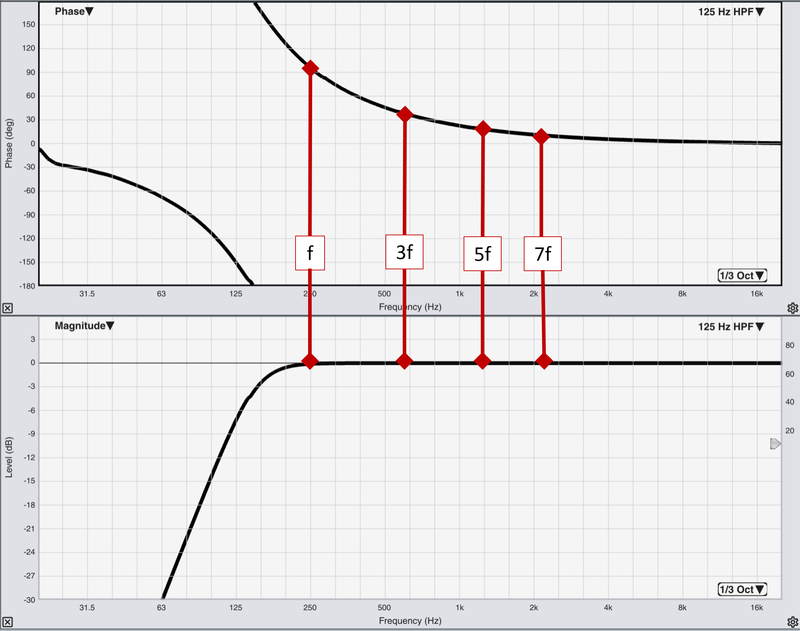
The previous figures, based on work by Charlie Hughes in his article “Square Waves and DC Content: Deconstructing Complex Waveforms” (6), serve to remind us that even small amounts of phase shift in our signal chain will “de-square” waveforms that were originally square. As we shall discover, this greatly complicates the act of passing a square wave through a modern sound system, even intentionally.
The Importance Of Crest Factor
No discussion of clipping behavior would be complete without consideration of crest factor, or the ratio between the peak and rms levels of a waveform. It is easy to see why most versions of Low Power Danger start with some mention of a sine wave (crest factor = 3 dB) that is fated to become clipped. After all, many amplifier power ratings assume full-scale sine waves, and it’s the rated power that is central to the discussion.
However, this is clearly not at all representative of typical real-world live music program material (crest factor >12 dB, often as high as 18 dB), and the reader is reminded that running full scale sine waves through their sound system is an inadvisable practice, clipping or not: for the same peak level (amplifier maximum output voltage), the sine wave has 9 dB higher Vrms than pink noise or other more typical program material, and so increases the power delivered to the load by a factor of 8.
We have unintentionally stumbled upon a key factor in understanding why our loudspeakers can burn out when the system is driven too hard. Remember that the Root Mean Square voltage (Vrms) of a signal is directly related to its heating power. In fact, the rms value of a waveform gives the DC voltage that would have the same heating effect on a resistive load.
In other words – it’s the signal’s rms voltage that determines how much the load (in this case, the voice coil) will be heated by the signal. The more you turn the system up, the hotter the voice coils will get, and if they can’t dissipate the additional heat, that’s when the trouble starts. (Of course, drivers also fail due to over-excursion, when signal peaks force driver displacement past its limits. The Low Power Danger situation, however, explicitly blames overheating, which means our interest lies in the Vrms applied to the high frequency driver.)
Clipping Real World Signals
It seems unfair to abandon our old friend the sine wave so soon, so let’s discuss the result of clipping a sine tone. The effects can be readily examined by applying gain to a normalized sine tone in an audio editor and measuring the resulting crest factor. (The authors recommend the excellent MLoudness Analyzer plugin from MeldaProduction Audio Technologies.)
A sine wave has a crest factor of 3 dB, and a square wave a crest factor of 0 dB, so the maximum decrease in crest factor that is possible to achieve by clipping a sine wave is only 3 dB, regardless of how much clipping occurs. 3 dB of clipping lowers the crest factor to 1.66 dB, and 6 dB of clipping lowers it to 1.1 dB. At a full 12 dB of clipping, crest factor has decreased to 0.5 dB. We observe that a certain amount of clipping does not reduce crest factor by the same amount.
This is even more pronounced for higher-crest factor signals. For pink noise (CF=12 dB), sample amplitude follows a Gaussian distribution, which means that higher-amplitude samples occur less often. For pink noise covering the bandwidth of 20 Hz – 20 kHz, a +12 dB sample will occur about once every 2 seconds, while a +15 dB sample will occur about once every two hours7. This means that when level is increased past the point of clipping, the first fatalities are the rare high-amplitude samples, while most of the waveform remains unchanged.
Thus, when a higher crest factor signal (pink noise or a live music mix) is increased in level past the point of clipping, the RMS value of the signal increases along with the increase in level, but the crest factor decreases by less, because peaks are rare. The same 12 dB of clipping that reduced our sinewave to a square-wave like 0.5 dB CF will reduce the crest factor of pink noise to about 3 dB, and the crest factor of the more arguably more music-like AES75 noise (also “M-Noise”) to 7.5 dB. With a real-world board recording from a live concert, 12 dB of clipping reduced the crest factor of the sample from 15 dB to 6 dB.
High crest factor signals, by definition, only have a small minority of sample values at or near peak amplitude, so even moderate amounts of clipping alter the waveform less than one might think. Thus, even when enduring significant amounts of clipping, real-world high-crest factor signals such as live music do not tend to create a waveform that bears much resemblance to a square wave (CF= 0 dB), as examination of a clipped music or noise signal’s waveform in an audio editor will reveal.
Thus, the answer to our second key question, “Does clipping an amplifier with real-world program material send a square wave to the loudspeaker?” is “no.” However, the substantial rise in RMS is noteworthy: the same 12 dB of clipping has increased the power content of the amplifier’s output by a factor of 16, which is deeply concerning.
Squares In – Squares Out?
Although it seems we can rest assured that the real-world clipping of typical live music signals will not, in fact, cause a square wave to leave the amplifier, let us assume for the sake of further exploration that we are undeterred by this information and feeling destructive. If we intentionally inject a square wave into our amplifier, what happens?
To investigate, the authors connected the output of a power amplifier to a basic passive 2-way crossover. The high frequency output of the crossover (2nd order at 2 kHz) was then connected to an 8-ohm resistive load in order for the crossover to achieve its intended response.
A square wave was then introduced to the amplifier’s inputs and measured with an oscilloscope at the amplifier outputs (orange trace in Figure 6) and at the high frequency crossover output (blue trace).
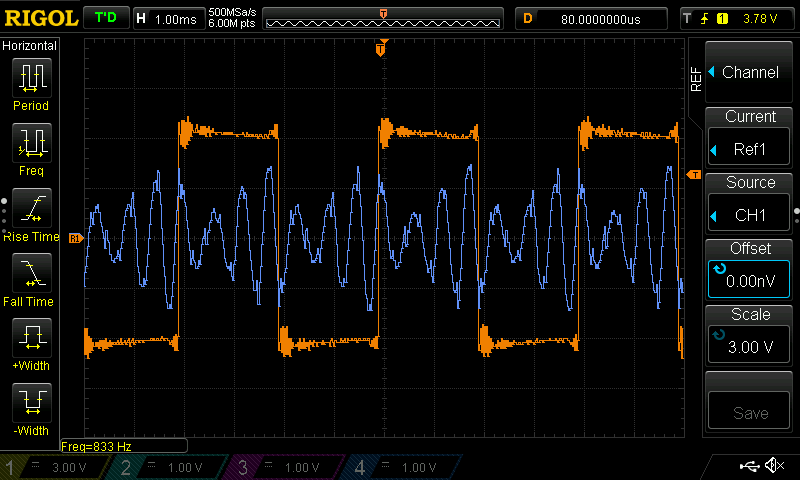
The waveform that is applied to the loudspeaker’s high frequency driver is decidedly not square. Since the flat tops of a square wave are a result of a specific phase relationship between the high frequency components, they disappear when crossover filters are introduced into the signal path and the resulting phase shift disrupts the relationship between the harmonics. Thus, short of intentionally applying a square wave directly to a full-range driver in free air, it is difficult to conceive of a real-world situation in which a loudspeaker driver reproduces a proper square wave.
Driver Displacement & Cooling
As a brief digression, one sometimes encounters the statement that the square wave stops the driver from moving, which in turn causes it to overheat due to lack of airflow. Again – the idea has curb appeal but quickly encounters complications. First, as Figure 6 indicates, the waveform applied to the HF driver is anything but square.
But what about the woofer? Air cooling due to motion is in fact a design consideration when dealing with woofers. Remember, it’s the extended series of HF harmonics that flatten the waveform. Figure 1 reminds us that the bandlimited version is also decidedly not flat. Of course, we must also consider the “unflattening” effects of phase shift in the signal path.
Attempts were made by the authors to pass a pure square wave though a HF driver (which, as detailed above, proves extremely challenging in practice) and to measure the resulting driver displacement with a laboratory-grade laser displacement sensor. Results were disappointing – the displacement of a modern HF driver, even at substantial SPL, is so miniscule that it proved impossible for the authors to measure accurately outside of laboratory conditions.
It may reasonably be concluded – and was confirmed by a representative from a leading manufacturer of professional loudspeaker drivers – that no significant cooling airflow is produced as a result, and thus displacement (or lack thereof) is not a contributing factor in HF driver thermal equilibrium.
It is also worth mentioning at this point that the appearance of the waveform describes the signal voltage, not the resulting voice coil displacement (8, 9). The voltage applied to a loudspeaker driver, along with the resulting current flow, produces an accelerative force, not a positional one. This is proven by applying a sine signal of constant amplitude, and varying the frequency – the resulting displacement will be greater for low frequencies than high frequencies, as there is more time for the voice coil to accelerate before reversing direction. The flat portion of a waveform doesn’t mean that the voice coil stops moving, but simply that no accelerative force is being applied to it.
Spectral Effects Of Clipping
Although clipping our real-world signals will not likely create a square wave or anything resembling one, it does generate high frequency harmonics which the loudspeaker’s high-frequency driver is then tasked with reproducing. To answer our third key question as to whether the clipping increase high frequency content enough to overheat a driver, we need to examine the change in spectrum when a real-world musical signal is clipped.
At a fundamental level, for the Low Power Danger claim to be true, the distorted waveform would have to apply a higher Vrms to the HF driver than the original, undistorted waveform as passed by an amplifier that’s not clipping. According to the Low Power Danger claim, that additional Vrms applied to the HF driver is supplied by the distortion harmonics caused by the clipping. This is, fortunately, easy to measure.
We return to the same test configuration as in the previous experiment: an amplifier connected to a passive crossover, which is in turn connected to a resistive dummy load. We monitor the signal level at the input to the amplifier and at the HF output of the crossover. When the system is operating linearly (not clipping), the increase in signal level at the amplifier’s input will equal the increase in signal level at the HF output.
Our interest lies in what happens once the amplifier begins clipping and becomes nonlinear. If the distortion harmonics pose a heating danger to the HF driver, the crossover output level would have to increase more than the increase in input signal, and the excess level increase indicates the amount of energy added by the distortion harmonics. It is this excess level that will serve to indicate that the underpowered amplifier poses a greater risk to the HF driver than a linear amplifier which exhibit no excess level increase.
We begin with the black trace at the top of Figure 7, which shows the broad long-term (entire song) average spectrum of a rock music sample used in the test, before being passed through the crossover filter. The black trace has been vertically offset for visual clarity, with the original level matching the lowest blue trace, labeled Reference, which shows the spectrum of the same signal as measured at the HF output of the crossover.
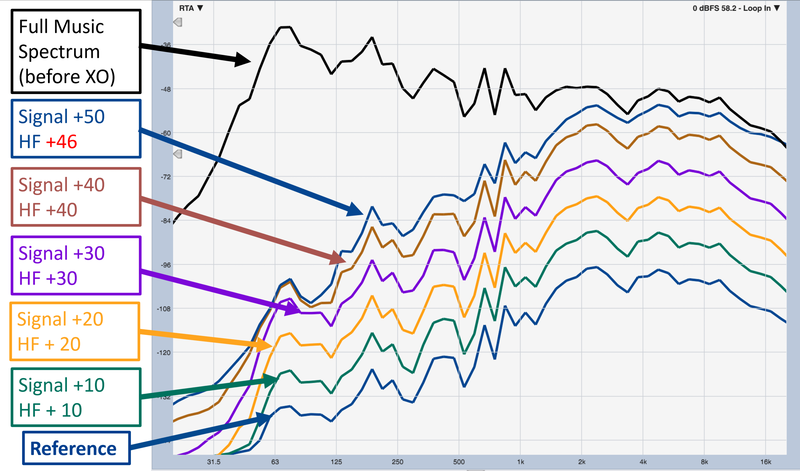
From there, the signal level is increased in 10 dB increments. Each 10 dB increase of input signal is mirrored by the same 10 dB increase at the HF crossover output, despite catastrophic levels of clipping (30 dB+). Finally, after a whopping 50 dB increase in input level, the HF output level is unable to keep pace, and has increased by only 46 dB from the reference condition. Therefore, even impractically huge amounts of clipping fail to generate any significant excess HF signal levels compared to what a linear, non-clipping amplifier would supply to the HF driver.
The same results were observed with many types of broadband signal, including music of various genres, real-world board mixes, pink noise, EIA-426-B noise, and AES75 noise. In all cases, the additional HF energy contributed by the clipping harmonics was too low to increase the overall HF signal level by any measurable amount, and therefore contribute in any substantial way to HF driver heating.
This is less surprising after considering the relatively low power content of the HF harmonics in a square wave. As Ross reminds us, by the 11th harmonic (6th frequency component), we are more than 20 dB down compared to the fundamental, or less than 1 watt for a 100-watt fundamental if we wish to think of it in terms of power. And of course – we didn’t start with a square wave, either. Although our ears are surprisingly capable at detecting harmonic distortion in relatively small amounts, their power content is so small that they are unlikely to exacerbate voice coil heating in any significant way.
Conclusion
After considering a number of factors, the most likely connection between clipping amplifiers and HF driver failure seems to be correlation, not causation. With real-world broadband program material, even severe clipping does not reduce the crest factor to the point that the waveform resembles a square wave.
A pure square wave intentionally produced by an audio amplifier is no longer “square” after encountering filtering, band limiting or phase shift. Although high frequency harmonics are generated by amplifier clipping, they do not contain sufficient energy to increase the RMS voltage applied to a HF driver such that it is likely to overheat sooner than in the absence of the clipping harmonics.
Therefore, the most likely cause of thermal damage and driver failure in relation to overloaded sound systems is likely the increased Vrms applied to the drivers due to the increased level. The level increase therefore causes an increase in driver heating, which the drivers may not be able to dissipate. This could prove to be harmful in even relatively small amounts (Vrms increase of 6 dB = 4 times the power delivery).
Previous works on the topic by Ross and Allison seem to correctly identify the most common cause of failure as thermal damage related to increased RMS, which will occur regardless of whether the amplifier in question is considered underpowered.
Acknowledgements: The authors wish to acknowledge the following people for reviewing this research and offering valuable feedback: Charlie Hughes, Bob McCarthy, Ethan Winer, Bennett Prescott, Sam Fiene, Dave Gunness, Merlijn Van Veen and Dr. Adam Hill.
References
(1) Electro-Voice EV PA Bible, retrieved Oct 30, 2022.
(2) Harman Professional, “Danger, Low Power: The Drawbacks of Using Power Amplifiers that are Too Small” – a JBL Professional Technical Note, retrieved Oct 30, 2022.
(3) Davis, Gary and Ralph Jones. Yamaha Sound Reinforcement Handbook. 2nd Ed. 1989.
(4) Allison, Roy. “Loudspeaker Power Needs,” Stereo Review, September 1973.
(5) Ross, Monty. RaneNote 128: Power Amplifier Clipping and its Effects on Loudspeaker Reliability. 1991.
(6) Hughes, Charlie. “Square Waves and DC: Deconstructing Complex Waveforms.” ProSoundWeb.com, October 2018.
(7) See AES2-2012, AES standard for acoustics – Methods of measuring and specifying the performance of loudspeakers for professional applications – drive units.
(8) Klippel, “Voice Coil Displacement.”
(9) Davis, Don; Eugene Patronis, Jr and Pat Brown, Sound System Engineering, 4th Edition. Focal Press. Chapter 18, in particular Fig. 18-96.