On the other hand, a delay of a few milliseconds was imperceptible.
In my guitar experiment, it seems that the delay isn’t noticeable at all up to about 10 ms (again). It becomes slightly noticeable between 10 ms to 15 ms almost like it’s not really an echo – just “something’s there,” but I could still play in time.
The delay started to get difficult to contend with somewhere around 15 ms to 20 ms, and above 20 ms, I really struggled with timing.
Now, this is an admittedly small sample.
However, after these tests, it appears that even with the subjects being told that it’s there, they couldn’t detect latency as echoes with less than about 10 ms to 15 ms of latency.3
Still, there is the other issue that arises when mixing non-delayed sound with delayed sound – phase cancellation or “comb filtering”.
DELAYED REACTION
Any time a sound arrives at different times, the sound interacts with itself to affect the overall frequency response.
This also affects response when a single sound reaches two microphones at slightly different locations at about the same level.
When a sound or electrical wave is mixed with a delayed version of itself, peaks and valleys in the frequency response graph appear due to the out of phase interaction between the two waves.
It’s easy to see how the “comb filter” got its name. (Figure 1) This frequency interaction is the basis for the long-standing 3:1 principle of microphone placement.

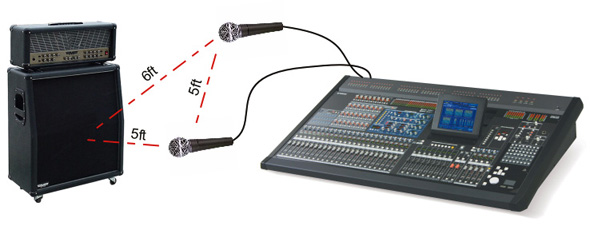
If two microphones are placed at a distance from a sound source where the sound is arriving at different times but with almost the same relative strength, the resulting signal mix will produce a comb filter effect. (Figure 2)

However, if the microphones are placed closer to each source and/or farther apart from each other, the strength of the unwanted signal in each microphone will be less and the effect is reduced.
When the distance between microphones is 3 times (3x) the distance from each microphone to its source, the strength of the sound at each microphone will lower than the other by approximately 9 dB. This reduces the maximum effect to about 1 dB, essentially inaudible.4
What about combing and in-ear monitors? Even though latencies less than 10 ms to 15 ms are not heard as echoes, latency can still cause audible changes in tone when the monitor audio mixes with the sound heard through the head.
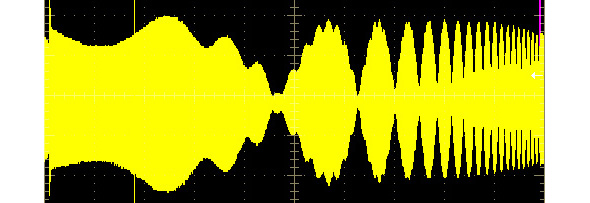
Figure 3 shows an oscilloscope screenshot of an electrical signal called a “sweep.” It is a burst of pure sine waves starting out at 20 Hz and extending on up to 20 kHz. The height or intensity of each portion of the wave is the same.
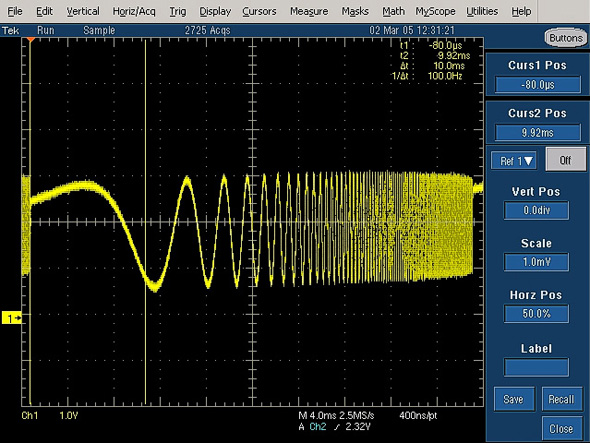
Figure 4, meanwhile, offers the same sweep signal that has been mixed with itself at the same level but with a latency of 10ms.
The oscilloscope’s persistence has been turned on to fill in the waveform to better illustrate the comb effect. Notice the peaks and valleys in the waveform where the waves have added and subtracted from each other.
The “notches” will occur at specific frequencies depending on the amount of delay. The frequency can be calculated with the formula: 1/delay and harmonics of this frequency will repeat throughout the bandwidth.
Therefore, the notches occur at 100 Hz, 200 Hz, 300 Hz, and so on, to 20 kHz. How much this wave is affected depends on the relative strength of the two waves, and the effect is most pronounced when the signals are equal strength.
The top screen in Figure 5 depicts the same swept wave, but mixed with a latency of 5 ms. The notches have changed width and have moved up in the frequency band to 200 Hz, 400 Hz, 600 Hz, again, to 20 kHz.

The bottom screen in Figure 5 shows the swept wave mixed with 1 ms latency. Now the notches are now located at 1 kHz, 2 kHz, 3 kHz, and so on.


