Test Equipment
“Empirical evidence trumps theory every time.”
Noise measurements are fairly simple to perform using a sensitive voltmeter, though the voltmeter must have a flat frequency response over the entire audible range.
Many budget models are not accurate above 5 or 10 kHz.
To measure its inherent noise, an amplifier or other device is powered on but with no input signal present; then the residual voltage is measured at its output.
Usually a resistor or short circuit is connected to the device’s input to more closely resemble a typical audio source.
Otherwise, additional hiss or hum might get into the input and be amplified, unfairly biasing the result.
Most power amplifiers include a volume control, so you also need to know where that was set when the noise was measured. For example, if the volume control is typically halfway up when the amplifier is used but was turned way down during the noise test, that could make the amplifier seem quieter than it really is.
Although it’s simple to measure the amount of noise added by an audio device, what’s measured doesn’t necessarily correlate to its audibility. Our ears are less sensitive to very low and very high frequencies when compared to the midrange, and we’re especially sensitive to frequencies in the treble range around 2 to 3 kHz.
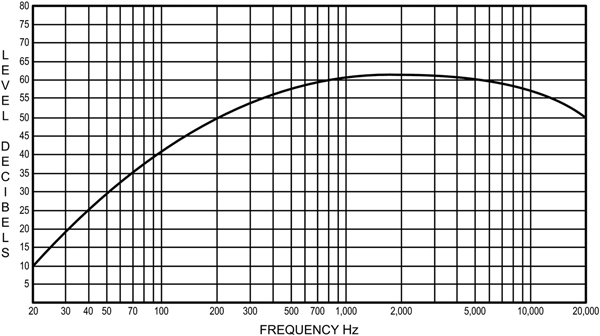
To compensate for this, many audio measurements employ a concept known as weighting. This intentionally reduces the contribution of frequencies where our ears are less sensitive. The most common curve is A-weighting, as shown in Figure 4.

In the old days before computers were common and affordable, harmonic distortion was measured with a dedicated analyzer. A distortion analyzer sends a high-quality sine wave, containing only the single desired frequency with minimal harmonics and noise, through the device being tested.
Then a notch filter is inserted between the device’s output and a voltmeter. Notch filters are designed to remove a very narrow band of frequencies, so what’s left are the distortion and noise generated by the device being tested. Figure 5 shows the basic method, and an old-school Hewlett-Packard distortion analyzer is shown in Figure 6.

Intermodulation distortion is measured using two test tones instead of only one, and there are two standard methods. One method sends 60 Hz and 7 kHz tones through the device being tested, with the 60 Hz sine wave being four times louder than the 7 kHz sine wave.
The analyzer then measures the level of the 7,060 Hz and 6,940 Hz sum and difference frequencies that were added by the device. Another method uses 19 kHz and 20 kHz at equal volume levels, measuring the amplitude of the 1 kHz difference tone that’s generated.
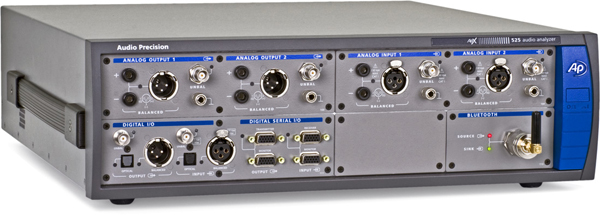
Modern audio analyzers like the Audio Precision APx525 shown in Figure 7 are very sophisticated and can measure more than just frequency response, noise, and distortion. They are also immune to human hearing foibles such as masking (1), and they can measure noise, distortion, and other artifacts reliably down to extremely low levels, far softer than anyone could possibly hear.
Professional audio analyzers are very expensive, but it’s possible to do many useful tests using only a Windows or Mac computer with a decent-quality sound card and suitable software. I use the FFT feature in Sony’s Sound Forge audio editing program to analyze frequency response, noise, and distortion.
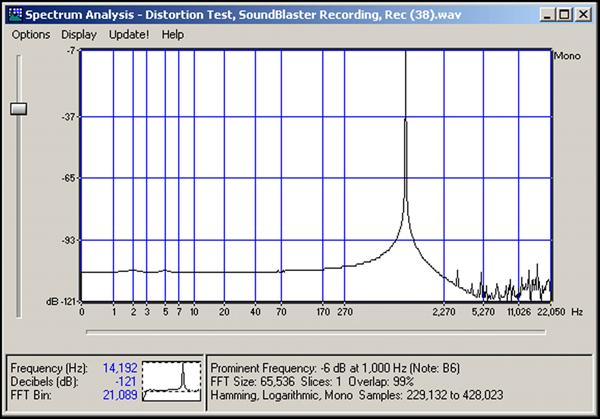
For example, when I wanted to measure the distortion of an inexpensive sound card, I created a pure 1 kHz sine wave test signal in Sound Forge. I sent the tone out of the computer through a high-quality sound card having known low distortion, then back into the budget sound card, which recorded the 1 kHz tone. The result is shown in Figure 8. (Other test methods you can do yourself with a computer and sound card are described in Chapter 22.)

As you can see in Figure 8, a small amount of high-frequency distortion and noise above 2 kHz was added by the sound card’s input stage. But the added artifacts are all more than 100 dB softer than the sine wave and so are very unlikely to be audible.
Low distortion at 1 kHz is easy to achieve, but 30 Hz is a different story, especially with gear containing transformers. Harmonic distortion above 10 kHz matters less because the added harmonics are higher than the 20 kHz limit of most people’s hearing. However, if the distortion is high enough, audible IM difference frequencies below 20 kHz can result.
Sadly, many vendors publish only THD measured at 1 kHz, often at a level well below maximum output. This ignores that distortion in power amplifiers and gear containing transformers usually increases with rising output level and at lower frequencies.
The convention these days is to lump harmonic distortion, noise, and hum together into a single THD + Noise spec and express it as either a percentage or some number of dB below the device’s maximum output level.
For example, if an amplifier adds 1 percent distortion, that amount can be stated as 40 dB below the original signal. A-weighting is usually applied because it improves the measurement, and this is not unfair. There’s nothing wrong with combining noise and distortion into a single figure either when their sum is safely below the threshold of audibility.
But when distortion artifacts are loud enough to be audible, it can be useful to know their specific makeup. For example, artifacts at very low frequencies are less objectionable than those at higher frequencies, and harmonics added at frequencies around 2 to 3 kHz are especially noticeable compared to harmonics at other frequencies.
Again, this is why A-weighting is usually applied to noise and distortion measurements and why using weighting is not unreasonable.
———————————————————————————————————————
1) The masking effect refers to the ear’s inability to hear a soft sound in the presence of a louder sound. For example, you won’t hear your wristwatch ticking at a loud rock concert, even if you hold it right next to your ear. Masking is strongest when both the loud and soft sounds contain similar frequencies.


