Q.) Amp power specs—are they RMS or peak?
A.) Please stand clear for the bombshell … there is actually no such thing as “RMS power.” Yes, the term is used frequently and is usually understood to mean continuous or long term, but technically, it doesn’t. So don’t rely on RMS to mean continuous power, because in actuality you can measure RMS voltage or current of any portion of a waveform, long or short.
RMS is correctly used to express AC voltage or current in useful terms. It helps solve the problem of measuring and expressing AC. By comparison, DC is a snap. Measure the voltage of a 9V battery. 9V. Measure it again. Still 9VDC. It doesn’t change, other than some slight fluctuations or sags due to loading or other influences.
On the other hand, AC changes constantly and rapidly. Your electrical service cycles 50 or 60 times a second. Audio runs from 20 up to 20,000 cycles each second. You could take a lot of instantaneous voltage measurements, like 20, -2, 92, 12, -29V.
But they wouldn’t at all be meaningful or accurate in describing the AC signal. You need to take AC measurements over a time period (either continuously or as many samples) and average them, and you also need to describe the measurements in terms that can be used to describe its power implications.
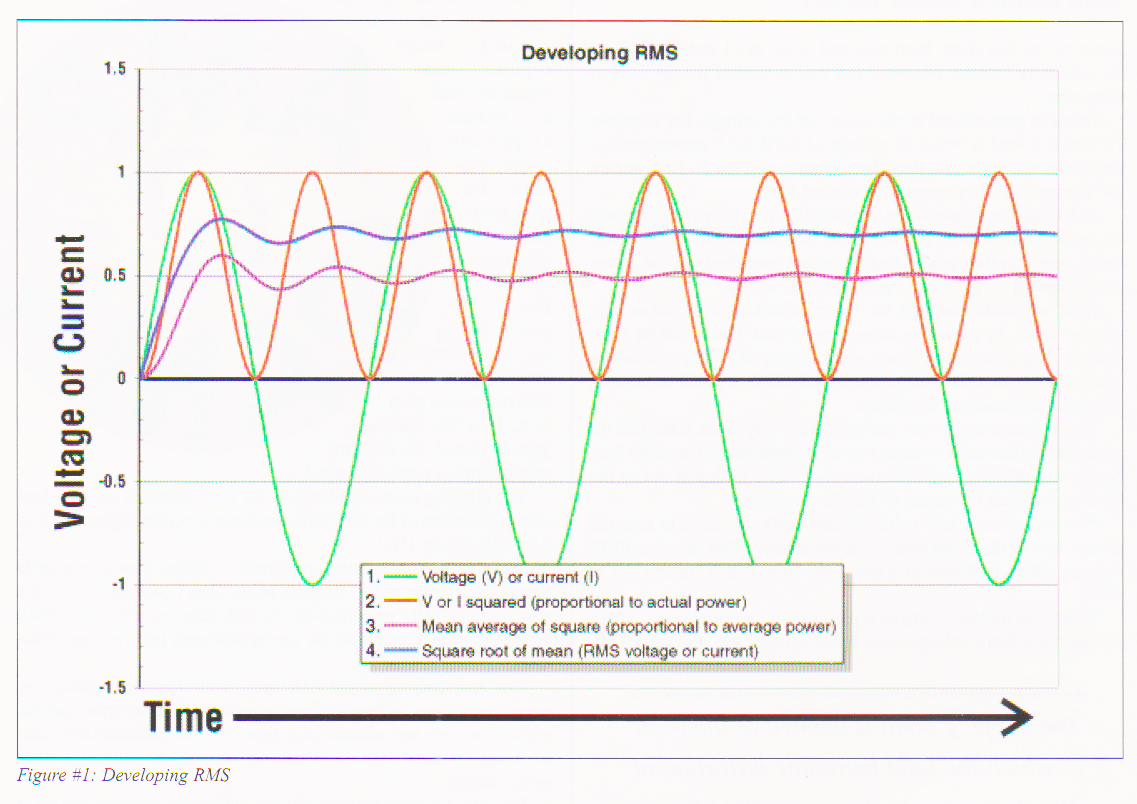
Thus there is RMS, which stands for root-mean-square. This is how it’s derived. First, there is the AC signal. In the illustration (at right), it is a simple sine wave (the green curve) that starts from zero and peaks at +1 and -1. It could be voltage or current, but we’ll just call it voltage for the sake of simplicity.
Power is proportional to the square of the voltage. For example, 1V across a load is twice the voltage of 0.5V, but it corresponds to four times the power. So that clues us into what we do first: square the voltage.
V2 is represented by the red/orange curve. Notice that its frequency is doubled, that it’s always positive, and its peaks are at +1 and 0. This curve is analogous to the instantaneous power in the circuit. And the actual magnitude of the power would depend on the current as well as the voltage.
Next, we need to average the power, which requires that we figure the mean. In an analog measuring circuit, this could be done with an integrator circuit. Some good quality AC RMS volt meters allow you to select the integration time. In DSP, it could be done as a simple mathematical algorithm.
The mean average power analog (analog only in the sense that it’s analogous to the mean average power) is depicted by the violet line. Notice that after its initial fluctuations it starts to flatten out on the 0.5 line, which is the center of the V2 waveform.
Now to get back into voltage terms again, we need to take the square root of the mean average power analog. That gives us RMS voltage, which is shown as the blue line. Note that it flattens out at 0.707.
When you multiply voltage times current, you get power. When you multiply RMS voltage times RMS current, you don’t get RMS power—you get average power. Therefore, what is often referred to as “RMS power” should actually be called “continuous average power.” And that’s what any decent and believable amp spec should mean when it shows a figure. And, please, don’t get me started about “peak” power specs for amplifiers.

