In 2009, a version of the log-swept chirp measurement specifically intended for testing acoustic devices was added to the APx platform. The measurement, named Acoustic Response, includes an Energy Time Curve result, controls for windowing out acoustic reflections for quasi-anechoic analysis, and several results of interest to users testing loudspeakers.
Limitations Of Quasi-Anechoic Measurements
As mentioned earlier, quasi-anechoic techniques work by windowing out the portion of the impulse response containing room reflections. Sometimes, this windowing truncates the impulse response before it has decayed to a sufficiently negligible level. This truncation causes errors in the estimated frequency response, especially at low frequencies.
For example, consider a situation in which the impulse response is windowed 5 milliseconds (ms) after its peak value. This would be a typical value for a small (bookshelf-sized) speaker measured in a room with a 2.74 meters (9 feet) high ceiling. With a measurement distance of d = 1.0 m and the distance h = 1.36 m (4.45 ft) to the nearest reflecting surface, the first reflection would arrive about 5.5 ms after the direct sound. Hence the impulse response might be windowed to a length of 5.0 ms.
Figure 2 illustrates the effect of windowing one loudspeaker’s measured impulse response at 5 ms after the peak. This data is from a measurement in a small acoustically lined hearing aid test box with an integrated full-range loudspeaker.
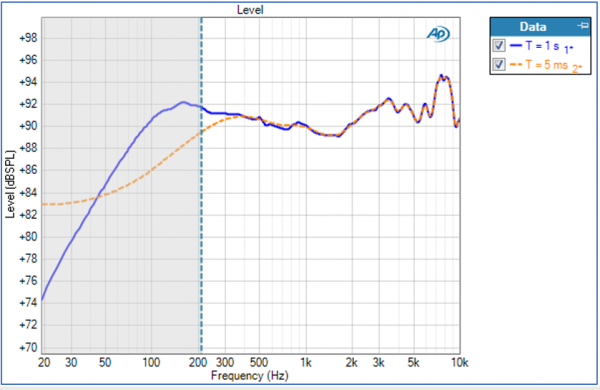
Although this test setup would preclude an accurate measurement of this loudspeaker’s response at low frequencies, Figure 2 does show the dramatic impact of windowing the impulse response. The windowed response is radically different from the un-windowed response below about 300 Hz, and the smoothing effect of the window is apparent up to about 1 kHz.
With a window width of T = 5 ms, the resolution in the frequency domain is about 1/T = 200 Hz. In the graph, the shaded region below 200 Hz is intended to indicate that the curve is unreliable in this region. But note that the effect of windowing extends to a much higher frequency than 200 Hz.
The duration of a loudspeaker’s impulse response depends mainly on its low-frequency roll-off characteristics [8]. To see this in an acoustical measurement, would require an impulse response measured in a perfectly anechoic environment with low ambient noise – difficult to obtain. However, the low-frequency behavior of a loudspeaker system can easily be modeled based on its resonant frequency and other parameters derived from simple electrical measurements of the system impedance.
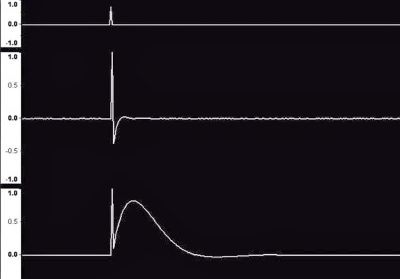
For example, Figure 3 shows the impulse response of an ideal small vented box system with a 127-millimeters (5-inch) diameter low-frequency driver. The impulse response is shown with a tapered rectangular window that ends 10 ms after the peak.
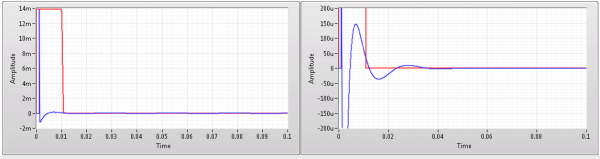
In the right half of the figure, the vertical scale has been increased by a factor of 40, to show the detail in the tail of the impulse response. As shown, a 10 ms window would severely truncate the impulse response. The corresponding frequency response magnitude for the un-windowed and windowed impulse response is shown in Figure 4. Note the errors below 100 Hz and the ripples in the response for the windowed impulse response.
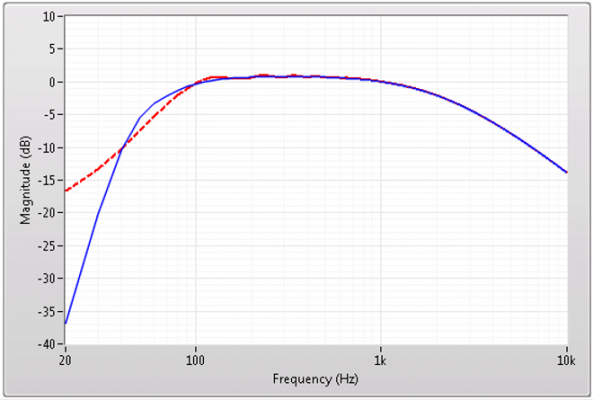
Figure 4 indicates that the tail of the impulse response has not decayed until 30 to 40 ms after the peak. It would require an impractically large room to ensure that reflections were delayed by 30 ms after the direct sound!
Methods of extending quasi-anechoic techniques to lower frequencies by shortening a loudspeaker’s impulse response have been proposed by Fincham [8] and more recently by Backman [9]. These appear to be effective. However, because their application requires modeling the loudspeaker’s low frequency response, Vanderkooy and Lipschitz [10] suggest that these impulse shortening techniques should not really be considered as measurement methods.
In the next part of the series, we’ll focus on combining near and far field measurements and many additional related facets.
Joe Begin, PE (Acoustical Engineering), a graduate of McGill University (B.Sc.) and the University of Canterbury (M.Sc.), has more than 35 years of experience in test and measurement. As director of applications and technical support at Audio Precision, he’s involved in product management, audio and electroacoustic test applications engineering, and technical support.
References
- M. Berman and L. R. Fincham. The application of digital techniques to the measurement of loudspeakers, JAES, 25, June (1977).
- Borish, J. and J. Angell, Measuring impulse response, JAES, vol. 31, pp. 478–488, July 1983.
- D. Rife and J. Vanderkooy. Transfer-Function Measurement with Maximum-Length Sequences, JAES., vol. 37, pp. 419–443 (1989).
- C. Heyser. Acoustical Measurement by Time Delay Spectrometry. JAES, vol. 15 pp. 370-382 (1967 Oct.).
- Farina, “Simultaneous measurement of impulse response and distortion with a swept sine technique,” Presented at the 108th AES Convention, Paris, France, 2000.
- Kite. Measurement of Audio Equipment with Log-Swept Sine Chirps, 117th AES Convention, Paper 6269, 2004.
- Müller and P. Massarini, Transfer function measurement with sweeps, JAES, vol. 49, pp. 443–471, June 2001.
- R. Fincham, Refinements in the Impulse Testing of Loudspeakers, JAES vol. 33, no.3. March 1985.
- Backman. Low-frequency extension of gated loudspeaker measurements. 124th AES Convention. Amsterdam, 2008. Paper 7353.
- B.Keele Jr., Low-Frequency Loudspeaker Assessment by Near-Field Sound Pressure Measurement. JAES, vol. 22, pp. 154-162, April 1974.