A Word About Arrays
While arrays complicate almost everything, one aspect that can be relied upon is that multiple cone drivers do not sum well – no matter how they are configured – at frequencies that approach, or are above, their break-up mode.
This fact provides additional rationale for getting out of the shared bandwidth as rapidly as possible. Again, I’d start with 48 dB/octave slopes and here I’ll make another recommendation: Linkwitz-Riley crossover shapes are hard to beat.
You’ll often read about how different crossover topologies (Bessel, Butterworth, Linkwitz-Riley) at various orders (i.e., first order = 6 dB/octave, second order = 12 dB/octave, and so on) possess differing characteristics. Certain topologies will sum in-phase at crossover while others will not. This is interesting, but mostly academic information.
What we’re concerned with is the measured system response which includes both the drivers and the crossover function. And with today’s excellent DSP crossovers, such as the XTA DP548 that was loaned to us for this series of articles, it’s a simple process to try different crossover types and rates so that you can view the results on your analyzer.
Though the idea of using an empirical process (trial and error) may not appeal to those who would prefer to predict the results mathematically, the fact is that even the best predictions are usually off somewhat and, even if perfect, still need to be verified by means of accurate analysis.
Quick Thought On FFT Analyzers
Speed. Yeah baby, that’s it. When you have to wait while an analyzer acquires a trace and then examine it in relation to other traces, the process is slow and tiresome.
Conversely, when you can move the measurement mic up, down, left and right to your heart’s content, and see the results in virtually real time, you have a tool that allows you to accurately characterize what the loudspeaker is really doing – both on and off axis.
Speed is everything. It allows you to try numerous changes to your crossovers and related filters, and then view the results immediately. What used to take days with chart recorders or other “static” means of displaying response curves, can now be compressed into hours or even minutes.
What’s The Breakup Mode, Precious?
Breakup occurs when any driver (LF, MF or HF) transitions from pistonic motion to vibratory motion. When a driver’s movement is primarily that of a piston, that is when its mass is moving forward and rearward as a single physical unit, it tends to behave linearly (It “tends” to do this because there’s more to the overall picture just that.
Factors such as how the surround is constructed, how the spider is mechanically loaded, and how linear the magnetic circuit is, will all affect the end results).
Conversely, when said driver stops acting like a piston and begins to vibrate like a wheel that’s grossly out of balance, that’s when it enters the breakup mode. It’s still producing energy that we can roughly characterize as sound, but it’s usually sound that we don’t want to hear.
And just like a wheel that seemingly becomes more and more unbalanced as the RPM increases, the driver “breaks up” more and more as the frequency increases.
The harmonic distortion starts to run away in terms of magnitude – even becoming unrelated to the fundamentals – which makes for some truly awful listening. Moreover, if frequencies below the breakup point are present at the same time as frequencies above the breakup point (a common occurrence in music), then a good dose of intermodulation distortion will be present too. Therefore, it’s a good thing to avoid using any driver in the part of the spectrum in which its breakup mode has occurred.
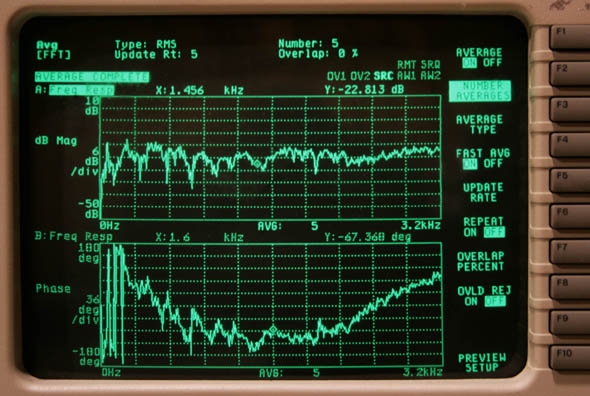
Figure 5 shows how a 12-inch cone and a 1.4-inch HF driver coupled to a 90-degree x 40-degree horn were optimized by using the techniques described above. The loudspeaker is an iHP1294 provided by Community Professional. As you can see, the results are a far cry from simply setting the crossover to a recommended value and going to lunch.

Although it takes time to optimize a loudspeaker system, it’s time well spent, and even more so if the loudspeaker will eventually become part of an array or cluster. There’s a good reason for this: if you can’t make a single loudspeaker measure and sound good – or hopefully great! – then it will be close to impossible to optimize an array made up of multiple units of that same loudspeaker.
Ken DeLoria is senior technical editor for Live Sound International and has had a diverse career in pro audio over more than 30 years, including being the founder and owner of Apogee Sound.
