REAL AUDIO SIGNALS
Sine waves are easy to look at to dramatically show the difference between polarity and phase.
Armed with this knowledge you can look at Figures 13 through 18 that show something like a real audio signal where the effects of polarity and phase are more difficult to see.
The signal shown in these figures was a generated by a mathematical algorithm that produces something close to a pink noise signal. Pink noise contains all frequencies with an equal amount of energy in each octave band.
Real audio signals don’t look much different than pink noise (but one would hope they sound better!).
The scales on these graphs are arbitrary. You can look at the vertical scales as +/-3 volts if you like.
However, because of the way the signal was generated, there was no way to define absolute time or degrees along the horizontal scales. Suffice it to say that the phase-shifted signal used in these figures was shifted by one data point out of the 240 data points that make up the signal lines.
There is one important thing to understand about phase shift. The amount of time one signal is delayed from another will have different effects at different frequencies. Assume there is a 1 millisecond time difference between two identical signals. At 500 Hz the result will be as shown in figure 10 because at 500 Hz the 1 millisecond time difference is a phase shift of 180 degrees. The signals are offset by 1/2 a cycle.
At 1 kHz the signals will be offset by 1 complete cycle. In other words you would hear one cycle from the first signal then both combine then you’d hear the one cycle from the second signal after the first stopped. This is similar to what is shown in Figure 12 (which shows only 1/2 cycle) but is not the result of the same conditions that were used to make figure 12. At 250 Hz the effect would be as shown in Figure 6 because a 1 millisecond time difference corresponds to a 90 degree phase shift at 250 Hz or an offset of 1/4 cycle. At lower frequencies the phase shift would be even less and the signals would tend to add as in Figure 2, approaching but never quite reaching the 6 dB increase shown in that figure.
Contrary to phase, polarity affects all frequencies the same way. It makes the positive portions negative and the negative portions positive. Put another way, it simply flips the signal over the same way at all frequencies. With these things in mind, examine Figures 13 through 18.
EFFECTS OF POLARITY AND PHASE ON “REAL” AUDIO SIGNALS
Figure 13: This shows a pink noise signal generated as noted above.
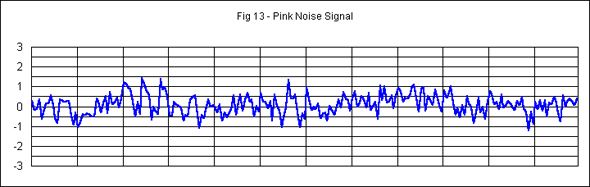
Figure 14: This shows both the original signal in blue and what happens when an identical but phase shifted signal is added to it, as shown in red. The red signal is similar to the combined signal shown in Figure 6. Note the increases in signal level and the changes in the waveform (many glitches). However you can also see the combined signal follows the original fairly closely.
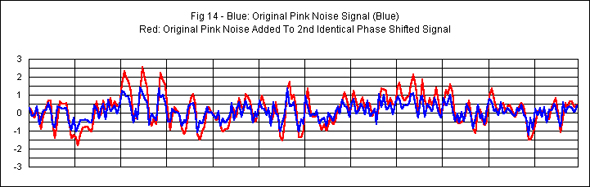
Figure 15: This shows both the original signal in blue and what happens when the phase shifted signal is also reversed in polarity and combined with it, as shown in red. In this case there are huge differences between the original and combined signal.
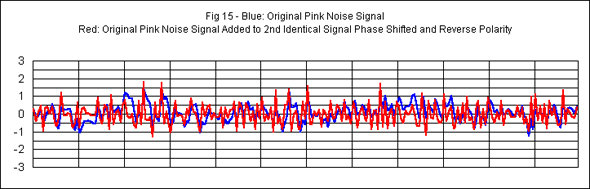
Figure 16: To better understand what is going on, this figure shows an averaged or integrated version of the pink noise signal in Figure 13. This is basically what would you would see if you graphed the readings from a typical SPL meter for the signal in Figure 13.
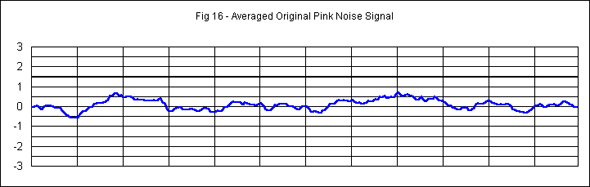
Figure 17: This shows the averaged signal from Figure 16, in blue, and the averaged combined signal from Figure 14, in red. Note that there are primarily level differences (mostly increases). Otherwise the two lines look very similar.
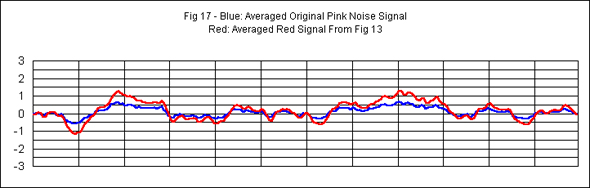
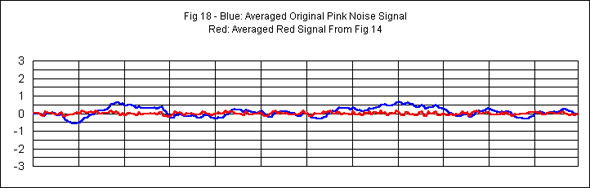
Figure 18: This really shows what is going on in Figure 15. The blue line is the averaged signal from Figure 16. The red line is the averaged signal from Figure 15. The red line shows that the out of polarity and phase-shifted signal approaches a straight line. Because you are looking at a broad frequency range, you are seeing a severe cancellation of the lower frequencies due to the polarity reversal.
However, unlike the low frequencies, the upper frequencies do not completely cancel due to the phase shift. The red line contains primarily high frequency energy. In the blue signal the higher frequencies are the small “bumps”. These can be clearly seen in the red signal and most of them correspond to those in the blue signal.