
Polarity and Phase – two terms are often used as if they mean the same thing. They are not.
POLARITY: In electricity this is a simple reversal of the plus and minus voltage. It doesn’t matter whether it is DC or AC voltage.
For DC, Turn a battery around in a flashlight and you have inverted or, more commonly stated, reversed the polarity of the voltage going to the light bulb.
For AC, interchange the two wires at the input terminals of a loudspeaker and you have reversed the polarity of the signal coming from that loudspeaker.
PHASE: In electricity this refers only to AC signals and there MUST be two signals. The signals MUST be of the same frequency and phase refers to their relationship in time. If both signals arrive at the same point at the same time they are in phase. If they arrive at different times they are out of phase. The only question is how much are they out of phase, or stated another way, what is the phase shift between them?
The important point to note in these definitions is that you can reverse the polarity of one signal and you can measure this change. You need two signals to measure a phase shift.
For convenience, the word “speaker” will be used in place of the more correct term “loudspeaker” in the rest of this article.
A PICTURE IS WORTH 1,000 WORDS…
The following figures show the differences and some consequences of polarity and phase. Figures 1 through 12 show graphs of sine wave signals.
Actually it is a sine wave from one signal source split two ways. Except for Figure 1, one of the splits is “processed” by reversing its polarity and/or by delaying it (phase shifting it) as described.
To put this in the real world, imagine two loudspeaker systems side-by-side, each reproducing one of the signal splits. (More precisely, the graphs show what you would see on an oscilloscope looking at the output of a mixing console with each split going to a separate input after one of the splits has been “processed.”)
The vertical scale in the graphs is in arbitrary units of -2 to +2 with lines at each 0.5 interval. If you like, consider this as -2 to +2 volts. Because phase shifts are measured in degrees, the horizontal scale in the graphs is labeled in degrees with a vertical line at each 90-degree point. One full cycle or period of a sine wave is 360 degrees.
Assume that the signals shown are 1 kHz sine waves, in which case each vertical line represents 1/4 millisecond of time. Sound travels in air about 3.4 inches (85 mm) in 1/4 millisecond so each vertical line also represents this distance. Note that in the graphs the signals all start 1/4 millisecond or more from the left so you can clearly see when each signal starts. (The importance of this will be seen in Figure 9.) There is no signal along the flat line from -90 to 0 degrees.
SIGNALS IN POLARITY, IN PHASE
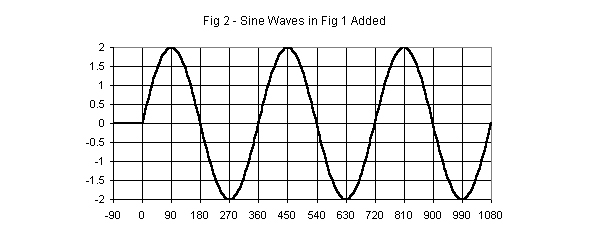
Figure 1: This shows 3 periods or 3 cycles of two simple sine waves. Both are +/-1 volt high at their peaks = total of 2 volts. One is shown in blue the other in red.
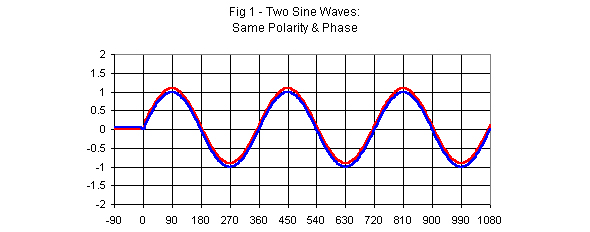
Figure 2: This is what happens when the two are combined (= added together). This is exactly what would happen on a line exactly between the two side-by-side speakers. The two signal beings being in phase and in polarity add up so the peaks are now at the +/- 2 volt lines = 4 volts or twice the original signals. Acoustically this is an increase of 6 dB = 20 x log(1+1).
SIGNALS OUT OF POLARITY
Figure 3: This is like figure 1 but the second sine wave, shown in red, has been reversed in polarity. As you can see the + and – voltage points are exactly opposite from the first sine wave, shown in blue. This would be accomplished by reversing the +/- input connection on the speaker reproducing the red sine wave.
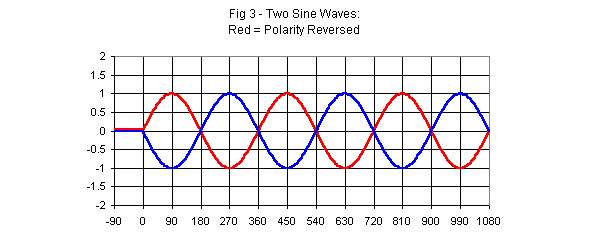
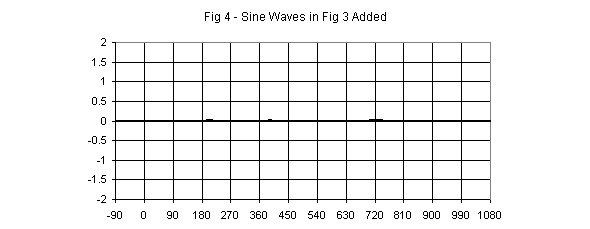
Figure 4: This is what happens when the two are combined. Each point of the two signals being in phase, but opposite polarity, adds up to zero. Acoustically this is an infinite decrease of output. Because you can’t take the log of 0 assume the difference is actually 0.0….01 volts (the dots = 58 more zeros). 20 x log of this number is -1200 dB. That should be pretty quiet. You can’t easily hear this with two speakers because of having two ears. But using a very carefully positioned microphone to measure this in a place with no sound reflections, you would find almost no signal.
SIGNALS OUT OF PHASE
Figure 5: The second sine wave, shown in red, starts 1/4 millisecond later (90 degrees later) than the first one, shown in blue. Put another way, the second signal has been delayed by 1/4 millisecond.
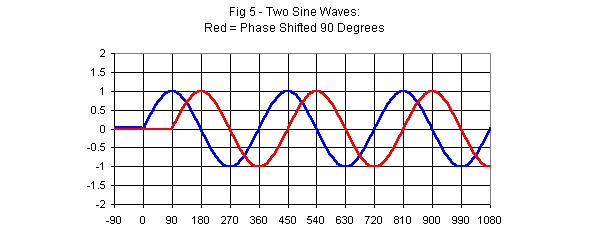
Figure 6: This is what happens when the two are combined and it’s pretty interesting. First notice that the peaks are almost at the +/-1.5 volt lines. The value is actually +/-1.414 volts. This is a 3 dB increase. This would be like listening to two speakers but the one reproducing the red sine wave is 3.4 inches (85 mm) further away from you than the other. The first thing you hear is only from the speaker reproducing the blue sine wave. The black line starts when the sound from the second speaker is heard and this line is the combined signal of both speakers.
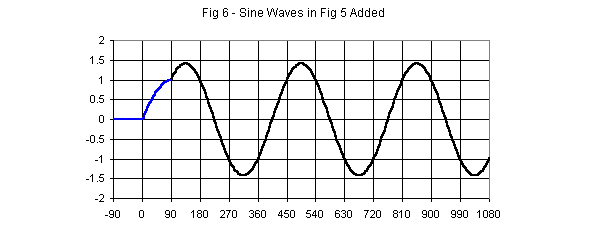
Suppose the speaker reproducing the red signal were only 2.25 inches (57 mm) further away. The signals would be shifted by only 60 degrees. The increase for the combined signal would be about 4.5 dB. So the amount of phase shift is important.
The second thing to notice is what happens at 1/4 millisecond or 90 degrees after the blue signal starts when the second signal “kicks” into the picture represented by the line turning black. There is a distinct change in the waveform.
The third thing to notice is that the entire waveform after the “glitch” is shifted in time compared to figure 7 about 45 degrees = average of 0 and 90 degrees.
SIGNALS OUT OF PHASE AND POLARITY
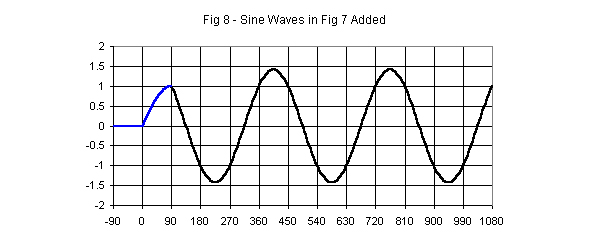
Figure 7: The second sine wave, shown in red, is a combination of the sine wave in figures 3 and 5. The signal not only has its polarity reversed but it is shifted in phase by 90 degrees compared to the first signal, shown in blue. In this case the speaker reproducing the red sine wave has its +/- input connection reversed in polarity and is 3.4 inches (85 mm) further away from you than the one reproducing the blue sine wave.
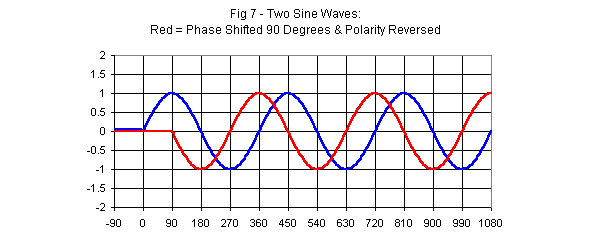
Figure 8: This is what happens when the two signals are combined. The picture is similar to figure 6 with two important differences. First the “glitch” at the point where the second signal starts is different. This is the point where the line turns black. Second is that the entire waveform is shifted by 45 degrees again but this time to the left of the original signal.