Years ago, a couple of smart guys named Thiele and Small characterized the behavior of cone drivers. One of their many excellent contributions was identifying how an electrical filter (passive or active) can be combined with the electro-mechanical-acoustical parameters of a cone driver, in a properly ported enclosure, to extend and optimize low-frequency output capability. In their work they refer to this as an “alignment.”
Here we’ll show you how to create a sixth-order alignment that is similar to the original Thiele-Small B6 alignment, but with an improvement that is now possible due to the extended capabilities of modern digital signal processing – specifically the ease with which a well-designed DSP can provide high-order filter shapes.
At the root of this is that most cone driver/enclosure combinations can be “tricked” into decreasing the frequency of their LF –3 dB cutoff point (read: minus 3 dB) by about a third of an octave, with very little loss in total output capability. We say “tricked” but that’s not really true. There’s solid math behind this process.
Before proceeding, it’s important to note that the -3 dB points in the LF and HF extremes are the de facto industry standard that determines the stated frequency response of a given system (i.e., 55 Hz – 17 kHz ± 3 dB). In Thiele-Small language, the -3 dB cutoff points are referred to as F3. Be careful though when comparing manufacturer spec sheets! Some footnote a wider tolerance, such as ± 4 dB (and even greater) in order to make their specs look better.
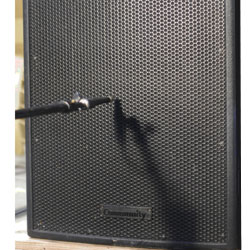
The devices utilized to acquire the data we’ll be using and showing in this discussion include a Community Professional iBOX-1294 loudspeaker (12-inch cone driver and 1.4-inch compression driver) in a bi-amplified configuration, an XTA DP548 digital processor, a Bruel & Kjaer 4007 microphone, a Jensen Twin-Servo mic preamp, and a Hewlett-Packard 35665A dynamic signal analyzer (Figure 1, above left).
First Things First
Let’s quickly look at the differences in sonic quality between a gradual LF roll-off (very typical of the systems of yesteryear) and a sharper “square-shouldered” roll-off. Many older ported loudspeaker systems exhibit a long, slow LF roll-off curve due the cone driver’s characteristics, the porting method, and the box volume (the latter is known as Vb in Thiele-Small vernacular). Sonically, the result is often a lack of a clearly defined spectrum in which the loudspeaker is intended to perform.
Put enough units of this type of loudspeaker together, and it might achieve scintillating bass from the LF acoustical addition, even well below the F3 point. However, this only occurs when there are many units present. With only one or just a few units, the LF response is likely to be muddy, and will overlap – not necessarily in a positive manner – with any subwoofers that might be present in the system (Figure 2).
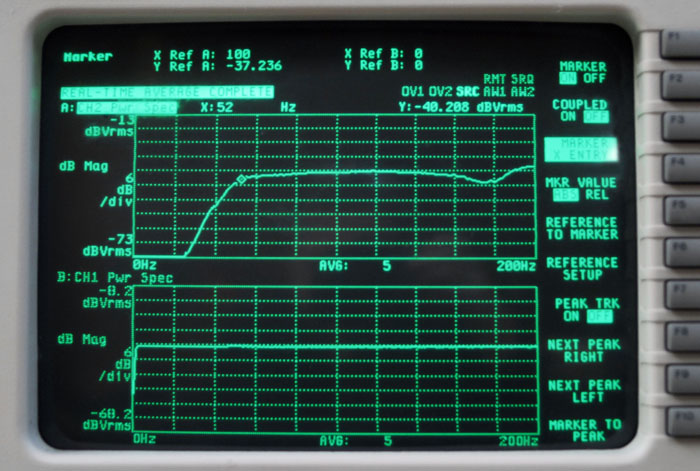
An alternate approach to merely building and porting an enclosure is to critically tune the enclosure in conjunction with a second-order (or higher) filter, thereby creating a B6 alignment. The EQ filter shape will look like it’s producing an LF bump in the response (lower trace in Figure 3), but once it’s properly adjusted to align with the response of the driver, the enclosure, and the port tuning, the measured acoustic response (upper trace in Figure 3) reveals extended bass that’s nominally flat.
Moreover, the LF response will fall within a more tightly defined range than the un-equalized response shown in Figure 2. The rapid roll-off below the new F3 frequency of 43 Hz results in the aforementioned “square shouldered” response curve.


