The GEQ mainly falls short on narrow cuts, which are not as common in system optimization, except maybe when dealing with stage monitor wedges. With a listening area the size of a single head, we are more able to use EQ to chase boundary effects and resonances that can often only be equalized for a single point in space.
The first three traces in Figure 1 were actually monitor wedge tuning curves, which is fitting since stage monitors are perhaps the “last bastion” for graphic EQs in the live audio world.
As an aside, it may seem particularly ironic that the main application for graphic EQs in a modern reinforcement context is dealing with feedback in stage monitors, since feedback is a narrow-band phenomenon, and the narrow cuts are where the GEQ displays the most inadequacy. Of course, we’re overlooking the human factor here – at the first hint of feedback, an experienced monitor engineer can reach out, grab the right filter, and bam. This is faster than dialing in several parameters on a PEQ, even with a well-designed touch interface.
The GEQ obviously runs out of gas when it comes to shelving filters, which are quite common in optimization, especially in the HF, and additionally they’re no substitute at all for crossover filters whose response continues to dive as we leave the passband. But for the in-band, bell / peaking filter topology, a GEQ can often – not always – be coaxed into creating a passable semblance of a target curve, albeit with a lot of tweaking and the patience of a saint.
Careful With Assumptions
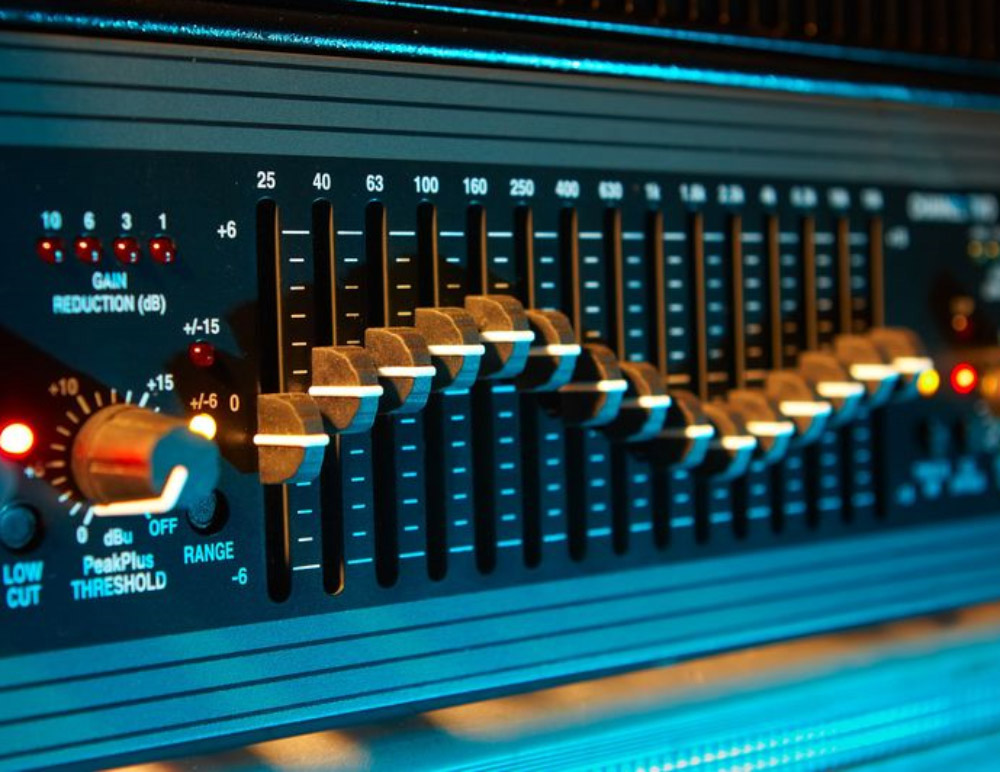
A related question is whether or not the shape of the faders on the front of the unit match the curve that’s created – the whole reason it’s called a “graphic” EQ. I gave the same treatment to console channel strip EQs and digital parametric displays in “Bend Me Shape Me” so once again let’s overlay the actual (Rational Acoustics) Smaart trace on top of the front panel controls and see how close we come (Figure 2).

The curve matches exactly, but the vertical scaling does not – we had to compress the trace considerably to get it to overlay, so don’t assume that 3 dB on the front panel translates to 3 dB in the actual curve.
One note here: some folks are concerned about the phase response, as it seems the GEQ has a bad reputation in that area. It isn’t so! A GEQ is a minimum phase device, so if the amplitude trace matches, so does the phase trace.

(The slight deviation at HF is due to a sub-sample timing offset in the analyzer’s latency compensation.)
Before running out and trading in your fancy digital parametrics for a rack of far-more-affordable graphics, let me clearly state that in my opinion using a GEQ for optimization is still a very bad idea. For starters, we’re starting here with established tunings and then painstakingly tweaking the GEQ filters until they match. This is a brutally slow task and isn’t something I’d want to do in the field.
Dealing with wide filters, the speed factor is reversed – it takes only a few seconds to dial in the parametric filters necessary to create these shapes, and much longer to fiddle with the graphics. And of course, out in the field, we wouldn’t have the convenience of starting with a predetermined parametric curve.
This is not a situation I’d want to deal with at the job site, especially given the hectic pace of a show build day, so I stand by my statement that GEQs are a poor tool for system optimization tasks. But I learned through this investigation that they will do if there are simply no better tools available, provided you have the patience and the time.