The difference is primarily in how they pick up sound at high frequencies, and this relates to how they are positioned relative to the sound source.
At higher frequencies (where wavelengths become so small as to equal, or be smaller than, the size of the microphone diaphragm) the direction in which the microphone is aimed – relative to the direction of the sound being measured – will have an effect on the accuracy of the measurement.
Random Incidence microphones are intended for use in a diffuse sound field where the sound is arriving from all directions due to a high level of reflections.
This type of microphone must be angled approximately 70 degrees to the sound source in order to yield accurate measurements.
Free Field microphones are designed for use in an open space (free of reflections) and should be held at 0 degrees to (pointed directly at) the sound source.
Pressure microphones are designed specifically for measurements in couplers and closed cavities such as plane wave tubes, ear cavities in dummy heads and for noise measurements in air ducts.
Some SLMs provide a switched correction filter allowing one type of microphone to be used in place of the other.
Note: In general, a “measurement quality” microphone differs from a recording or sound reinforcement microphone in its flat response, the absence of an onboard preamp, and its less rugged construction.
Detector Averaging Time
The standard averaging time choices provided by the majority of SLMs are Fast and Slow.
The Fast setting has a 125milliseconds (mS) averaging time (developed in 1950 to match the ballistics of the moving coil meters used at that time) and is useful for steady state (not dynamic) sound.
For measurement of more dynamic sound (when the Fast setting results in fluctuations of 4 dB or more), the Slow setting provides a 1 second averaging time resulting in much more consistent and stable readings.
It is this setting (along with an A-weighting curve) that is most frequently used for measurement of pop music SPLs.
Some higher priced SLMs also provide Impulse response time (four times faster than the Fast setting) used for extremely dynamic and short term (impulse) sound and peak response time, which accurately responds to signal pulses as short as 50 microseconds.
Frequency Weighting Filters
Because we humans do not hear frequencies in a linear manner (as illustrated in the often referred to Fletcher-Munson curves, aka: equal loudness contours), sound level measurements made with a flat response do not accurately reflect how we perceive sound.
When measuring pop music sound reinforcement systems (with the program signal containing generous amounts of bass energy), broadband readings would be artificially high without the frequency shaping provided by the A-weighting filter.
C-weighting, with its more gradual low-and high shelving filters, is used for very high SPL sound system and noise measurements.
On SLMs without a Flat setting, the C-weighted setting may be used to feed a spectrum analyzer such as Rational Acoustics Smaart for frequency analysis of the broadband sound.
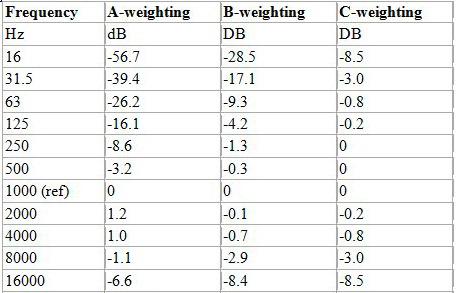
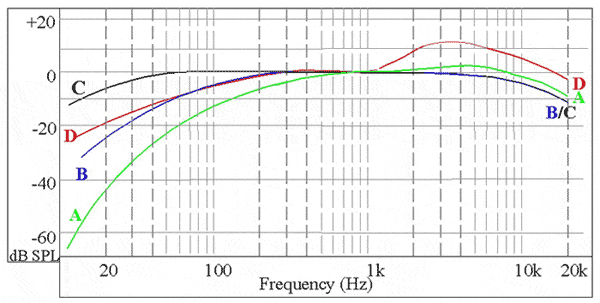
Table 2 below, and then Figure 2 below that, show the frequency response for A and C weighting filters, plus two other weighting filters employed for more exacting and specific noise measurements.
All weighting curves are equal in level at 1,000 Hz, the standard reference frequency that SLMs are calibrated to using acoustic calibrators.
Note On SPL Annotation: When communicating or recording (speaking or writing) SPL values, it is necessary to annotate what – if any – weighting curve has been employed. A-weighted SPL is written or stated as “XX.X dBA” and C-weighted measurements as “XX.X dBC”. Such annotation eliminates the need to provide the “SPL” suffix.
The absence of weighting notation implies that a Flat setting (no weighting filter) was used and in this case the suffix “SPL” must be used to differentiate from other, non-acoustic decibel values.
Historical Note: The A, C and B frequency weighting curves were first developed for specific sound levels based on equal-loudness contours.
Because equal-loudness contours were developed from research utilizing pure tones, it later became evident that the weighting curves chosen for SLM measurements at certain levels do not correlate very well to how we actually hear complex sounds.
More recently it has been found that the A-weighting curve provides a realistic approximation of how we hear over a fairly wide range of sound level measurements.
Display
With very few exceptions, modern SLM’s are provided with LCD displays with 3- or 4-digit readouts. Most of these provide 1/10-dB resolution except in the case of 3-digit displays when they go over 100 dB-SPL.
Prior to LCD technology, analog meters were employed and these suffered from all the inherent shortcomings of this method of display: slow rise and settle time, susceptibility to damage from pinging (over loading) and overall mechanical fragility.
Another shortcoming of analog meters is the difficulty in establishing stable readings due to the range selecting that is common in most SLMs. One must take the range that is selected and then add or subtract from the meter position accordingly.
Measurements made when the sound pressure level has changed and is out of range are prone to be inaccurate, as well. Some feel that fast impulse noise measurements are easier to read with an analog SLM than with a “digital” SLM.


