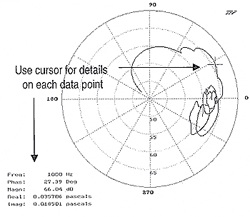
Note that in the diagram the cursor is set at the point where the reverse rotation begins, the cursor coordinates being indicated to the lower left of the plot.
This situation can also occur with a digital crossover net work where one frequency range has one delay associated with it and the other frequency range still another delay.

In measuring phase response, choice of a correct origin and time is paramount if you want a meaningful measurement of the phase response of a device rather than a delayed measurement of the signal path.
For a quick overview of the acoustic signature from a loudspeaker array I know of no tool that is the peer of the Nyquist plot.
When large complex acoustic arrays require a rapid overview that will allow analysis of what problems, if any, are present, the Nyquist instantly tells which component relationships are incorrect, be it signal synchronization, digital crossover or other delays not obvious.

Also obvious are inverted polaritys, unexpected resonances or even measurement mistakes in choosing the correct signal origin.
The Nyquist plot, as embodied in contemporary acoustic analyzers, usually computes at the bottom of the screen the values for frequency, real part, imaginary part, phase, and magnitude for a given cursor position on the screen.
Moving the cursor allows clockwise or counter clockwise frequency changes to be observed.

Ron Bennett, many years ago, provided me with a program that allows acquisition of the real and imaginary part separately, i.e., acoustically as pressure and velocity: electrically as voltage and current; impedance as real and reactive.
After acquisition it then forms a complex analytic signal from those two parts for display. One innovative use is to see the complex signal formed by the left ear/right ear signals using ITE microphones.
What in 1928 was a truly laborious process, is today a major convenience and an important tool.
Don and Carolyn Davis are the founders of SynAudCon, the leading independent educational organization in professional audio.