Editor’s Note: The following article is an excerpt from the new white paper “Smaart 7 Impulse Response Measurement and Analysis Guide,” available as a free download (pdf) from Rational Acoustics. Go here for the direct download of the guide, and also note that sample IR wave files used for figures within the document can be downloaded as a zip file here.
———————————————————-
What is an impulse response? In the most basic terms, an impulse response (IR) can be defined as the time domain (time vs amplitude) response of a system under test (SUT) to an impulsive stimulus.
The word “system” in this case could mean something as small as a microphone or a single transducer, something as simple as a single filter on an equalizer. Or, it might mean something as big as a concert hall or sports arena, as complicated an entire sound system or a combination of the two. Smaart users of course are most often concerned with sound systems and their acoustical environments.
In the context of acoustical analysis, you might also think of an impulse response as the acoustical “signature” of a system. The IR contains a wealth of information about an acoustical system including arrival times and frequency content of direct sound and discrete reflections, reverberant decay characteristics, signal-to-noise ratio and clues to its ability to reproduce intelligible human speech, even its overall frequency response. The impulse response of a system and its frequency-domain transfer function turn out to be each other’s forward and inverse Fourier transforms.
An acoustical impulse response is created by sound radiating outward from an excitation source and bouncing around the room. Sound traveling by the most direct path (a straight line from the source to a measurement position) arrives first and is expected to be the loudest. Reflected sound arrives later by a multitude of paths, losing energy to air and surface absorption along the way so that later arrivals tend to come in at lower and lower levels.

In theory this process goes on forever. In practice, the part we care about happens within a few seconds – perhaps less than a second in smaller rooms and/or spaces that have been acoustically treated to reduce their reverberation times.
The arrival of direct sound and probably some of the earliest arriving reflections will be clearly distinguishable on a time-domain graph of the impulse response. As reflected copies of the original sound keep arriving later and later, at lower and lower amplitude levels, they start to run together and form an exponential decay slope that typically looks like something close to a straight line when displayed on a graph with a logarithmic amplitude scale.
Anatomy Of An Acoustical Impulse Response
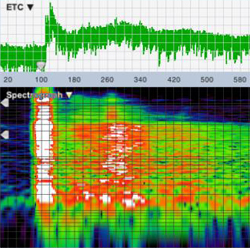
Although no two non-identical rooms ever have identical impulse responses, there are a few component features that we can identify in some combination in almost any acoustical impulse response. These include the arrival of direct sound, early reflections, reverberant build-up and decay, and the noise floor. Figure 2 shows an acoustical impulse with its component parts labeled. Descriptions for each follow.
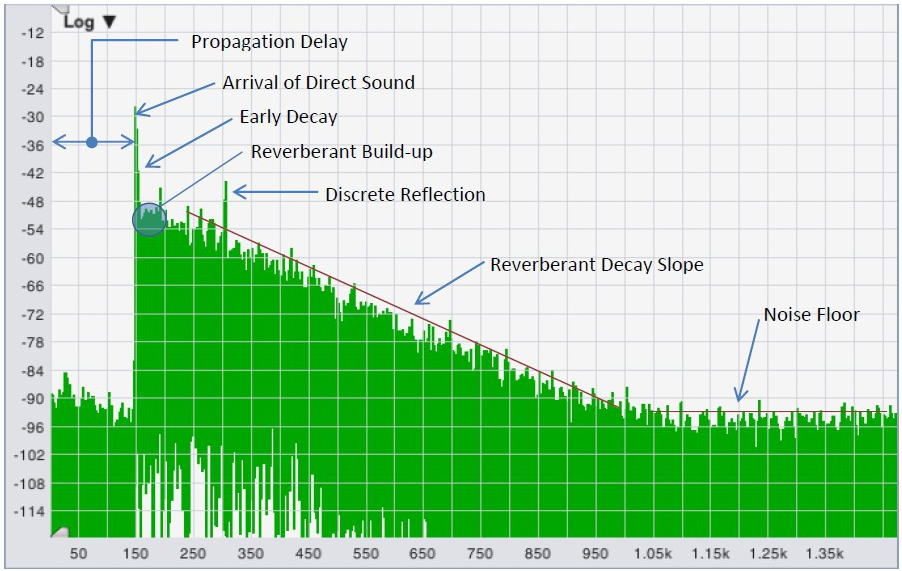
Propagation Delay. The time that it takes for direct sound from the sound source to reach the measurement position is the propagation delay time. This may include throughput delay for any DSP processors in the signal chain in addition to the time that it takes for sound to travel through the air.
Arrival Of Direct Sound. Since the shortest distance between two points is always the straightest line, the first thing we expect to see when looking at an impulse response (IR) is the arrival of direct sound from whatever sound source we’re using to stimulate the system under test. Depending on what we’re trying to learn, the source could be an installed sound system, an omnidirectional loudspeaker brought in specifically for measurement purposes, a balloon pop or a shot from a blank pistol, or in a pinch, maybe hand claps or someone slamming a case lid shut.
In most cases we’d also expect the first arrival to be the loudest, and correspond to the highest peak we can see in the IR, and in most cases we’d be right. There can be occasional circumstances where that might not turn out to be strictly true, but in the vast majority of the cases it should.
Discrete Reflections. After the arrival of direct sound, the next most prominent features we tend to see are sound arriving the next most direct paths; the lowest order reflections. Sound that bounces off one surface to get from the excitation source to a measurement position is called a first-order reflection, two bounces gives you a second order reflection and so on. Reflected sound can be useful or detrimental, depending on factors such as its relative magnitude and timing in relation to the direct sound and the extent to which it is clearly distinguishable from the diffuse reverberant sound.
Early Decay, Reverberant Build-Up, And Reverberant Decay. Following the arrival of direct sound and the lowest order reflections, sound in a reverberant space will continue bouncing around a room for a while, creating higher and higher order reflections. At any given listening position, some of this reflected energy will combine constructively over a relatively short period of time, resulting in a build-up of reverberant sound, before air loss and absorption by the materials that make up reflecting surfaces begins to take their toll. At that point, the reverberant decay phase begins.
In practice, you may or may not be able to see the reverberant build-up in an impulse response as distinct from the direct sound and early reflections. Sometimes it can be quite clearly visible, other times not so much. By convention, the first 10 dB of decay after the arrival of direct sound in the reverse-time integrated IR (we will get to that in the next section) is considered to be early decay. Reverberant decay is conventionally measured over a range from 5 dB below the level of direct sound down to a point 30 dB below that on the integrated IR, or 20 dB in a pinch.
Noise Floor. In theory, the reverberant decay phase of the IR continues forever, as an ideally exponential curve that never quite reaches zero. In practice it reaches a point relatively quickly where we can no longer distinguish it from the noise floor of the measurement. Noise in an IR measurement can come from several sources, including ambient acoustical noise, and electrical noise in the SUT and the measurement system, quantization noise from digitizing the signal(s) for analysis, and process noise from DSP processes used for analysis.
Uses For Impulse Response Measurement Data
Delay Time Measurement. The most common use for impulse response measurements in Smaart is in finding delay times for signal alignment in transfer function measurements and for aligning loudspeaker systems.
Each time you click the delay locator in Smaart, an IR measurement runs in the background. In this case all we really care about is the initial arrival of direct sound, which is typically so prominent that you can pick it out with high confidence even when signal-to-noise ratio of the IR is poor, so we don’t even bother displaying the results.
Smaart simply scans for the highest peak and assumes that to be the first arrival, and most of the time that works very well.


