
Following are some examples of common plots found on data sheets, with plain English descriptions of what each one means. After digesting each, download some data sheets from various manufacturers and attempt to interpret them.
Use them to form an understanding of the product, what it does, and how it might compare to a similar product. Remember that to fully describe the performance of a product, and infinite number of graphs would be required.
Most “one number” ratings in audio and acoustics have little meaning. They usually over-simplify something that is much too complex to specify with a single number.
Unfortunately, many people base their gear-buying decisions on this meaningless data, and then wonder why the gear does not live up to their expectations. A graph is much better, but even graphs can’t tell the whole story. We live in an amazingly complex world!
What’s The Frequency?
In Figure 2, the independent variable is frequency. The dependent variable is level. The frequency response plot answers the question “What is the relative on-axis level change of the device-under-test regarding frequency?”

For a device that produces the same level at every frequency, the plot would be a straight, horizontal line. A real-world loudspeaker response is also shown. Some would consider a flat line response to be the best possible loudspeaker; however, a spectrum plot alone does not tell the whole story.
Now, let’s turn to Figure 3. Again, the independent variable is frequency, while the dependent variable is the on-axis directivity. The directivity plot answers the question “What is the ratio between the sound intensity on-axis to the total radiated sound intensity as a function of frequency?”
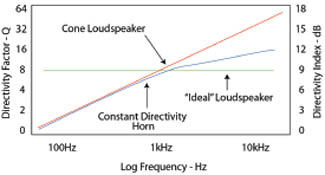
Q = 1 means that the device is omni-directional, where Q = 10 means that the intensity on-axis is 10 times the average radiated intensity. Q = 100 means that the axial intensity is 100 times the average intensity.
Another way of describing the same thing is to use the directivity index, which is the Q rating converted into decibels with the formula DI = 10logQ. It yields the same information in decibels, giving the loudness advantage produced by controlling the sound radiation. DI and Q are often found on the same plot.
Turning our attention to Figure 4, once again the independent variable is frequency. The dependent variable is impedance. The impedance plot shows the opposition produced by the loudspeaker to current flowing from the amplifier as a function of frequency.
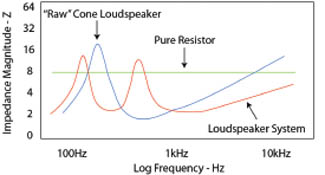
A large peak on the curve means that less current is drawn at the frequency of the peak. This can happen at frequencies where the loudspeaker system is resonant, i.e. vibrates naturally.
Other frequencies require much more current to produce the same sound pressure level. Low spots on the curve represent frequencies where maximum current is drawn from the amplifier, i.e., where the amplifier is under a greater load. The low values should be used when determining the required gauge of loudspeaker wire that should be used, or how many loudspeakers can be run in parallel.
Impedance is also required to calculate how much amplifier power is delivered to the loudspeaker, which in turn allows the loudspeaker’s power handling limits to be assessed. This is a good example of where a single number impedance rating (often called the nominal impedance) serves as little more than a guideline. The impedance plot paints a much better picture of impedance and the other ratings that come from it.
Always remember to use specification sheets for what they’re intended – determining the suitability of a product for an application. They are not a substitution for listening and measurement when evaluating products and should not be the final word in the buying decision.
A famous physicist once said, “The data on a spec sheet may be the best data they ever took or the only data they ever took!”