In the days when digital signal processing (DSP) first stalked the arena, it was the folks at front of house that had all the fun. They would ignore their comm light for long periods of time while staring intently at asymmetrical crossovers on their laptop displays.
But now that DSP is ubquitous, the people at the other end of the snake are beginning to experience the joys of audio in the digital domain.
The real beauty of DSP in monitorland is in optimizing wedges and side fills so that little or no equalization is needed to minimize feed back.
You might have a rack full of graphics, but the show will start out with all of them set flat. These units will only be used for on-the-fly feedback reduction or to ”personalize” a mix.
And with DSP, a preset can be designed for each model in your inventory, particularly useful if you have multiple wedge types. So let’s get on to the tweaking part.
Very few monitor cabinets are inherently “flat”. There are compromises made due to factors like box size versus low frequency driver selection, box size versus horn selection, low frequency driver dispersion versus. crossover frequency, etc.
Your favorite microphones also have frequency anomalies, especially in off axis response. Combine the two and things can get quite complicated.
Many of these problems cannot be completely cured, but with some DSP horsepower and modern test equipment, they can be minimized.
The first step is to achieve flat on-axis response from your monitors. I would highly recommend that if you don’t already own Gold-Line TEF, Rational Acoustics Smaart, or at least a real-time analyzer (RTA) then beg, borrow or steal some audio analysis equipment for this portion of the procedure.
At an AES convention a few years ago, an equipment manufacturer that I have a relationship with set up a loudspeaker, an EQ and a pink noise source in their booth. Passersby were invited to try to equalize the pink noise by ear to achieve a flat response from the loudspeaker.
One person was spot on, but most of the results were pretty scary, even though the participants were all audio professionals. We need accuracy of +/-1 or 2 dB to give us a truly flat baseline to work from.
Some may have the ears to accomplish this, but most of us don’t. If you’re using an RTA, be sure to get one that displays in increments as small as 1 dB.
Measuring the low frequency response of a loudspeaker minus the room’s acoustic contribution is a somewhat tricky proposition. A 40 Hz wavelength is approximately 28 feet long.
In order to measure those frequencies properly with a time windowed measurement system the window has to be long enough to contain at least one full wavelength.
Unfortunately that means that it is long enough to contain room reflections that contaminate the measurement. At higher frequencies this is not a problem because the wavelengths become short enough for the windowing to provide anechoic measurements.
Because real-time analyzers are time blind they include room reflections at all frequencies.
Testing Methods
There are a couple of ways to deal with this. One is to do your testing outdoors far enough from any buildings to minimize reflected energy.
My favorite approach comes from Don Keele, one of the really smart guys in our industry. He places the measurement microphone about one inch from the center dome of the woofer, takes a measurement, then places the mic one inch from the port, takes a measurement, and then sums the two responses.
The signal-to-noise ratio of the measurement is improved greatly because of inverse square law gains that result from being so close to the source.
A word of caution here: if the device under test has a maximum output of 120 dB at one meter, it’s output at one inch will approach 136 dB. This may be enough to do bad things to your expensive measurement microphone.
So start out at a fairly low volume level and work your way up. This test will give you a good idea of what is going on from 200 Hz on down.
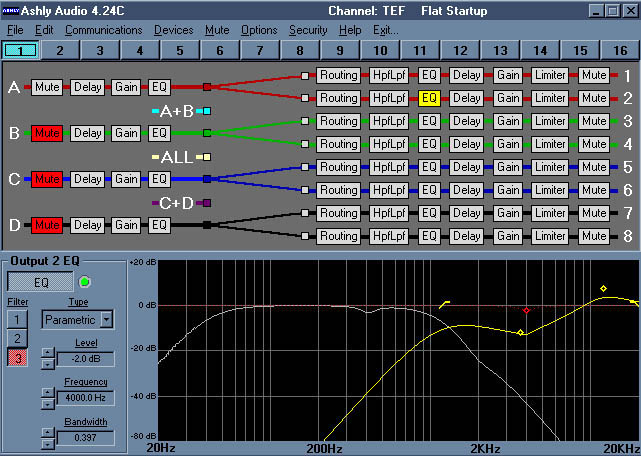
The first parameter I set is a high-pass filter to prevent signals that the box is not capable of reproducing from wasting power and potentially damaging components.
Then correct any large EQ anomalies with parametric filters. The microphone can be moved to normal listening distance for this and all subsequent tests.
Make sure that the distance is at least three times the longest dimension of the box under test. This puts us in the far field. I do this test with no crossover engaged for the low-frequency device.
If you test from 200 Hz to, say, 5 kHz, you get a good idea of the total low frequency response curve of the box.
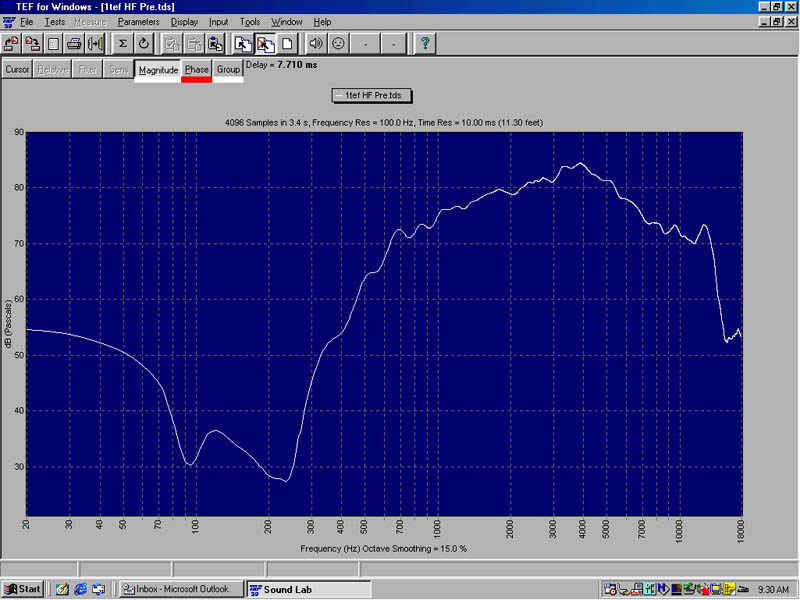
Next, look at the upper range of the device’s response curve. There will be an obvious point where the amplitude drops off or the speaker gets into breakup modes represented on the test display by narrow notches and/or peaks.
Use parametric filters to flatten the response as much as possible within the useable range of the device. Choose an upper crossover point for the woofer that filters out the nasty modes and only utilizes the relatively flat part of the speaker response.
The high-frequency test is next. I prefer doing this test with no crossover engaged, however, the sweep frequency must be started at a high enough frequency to avoid damaging the driver.
Check the manufacturer’s recommendation for the lowest suggested crossover point and start your sweep there. If full range pink noise is being used as the test signal, start with the crossover engaged to protect the driver.
Using the parametric filters in your DSP of choice, correct for frequency response anomalies.


