
“If you don’t know the answer before you start to measure, how do you know you are getting a good measurement?” – Ivan Beaver, chief engineer, Danley Sound Labs
Of I were to ask you to measure the voltage coming out of the electrical outlet closest to you using a multimeter or VOM (volt‑ohm‑milliammeter), you would have expectations. However, should the multimeter’s display, for whatever reason, not show the expected voltage for your specific region, there’s a valid reason to start investigating. Maybe the meter’s batteries are dead or maybe a circuit breaker tripped. Regardless, you were right to question the outcome because it didn’t meet expectations.
By extension, one can argue that the same can be said for using a dual‑channel FFT analyzer, except that most users have difficulties predicting what the results are supposed to look like and are tempted to accept the outcome at face value with little to no scrutiny. Complicating matters further: how the analyzer is set up will greatly affect the appearance of the results, which is the focus of this article.
Loudspeakers with a flat (or otherwise desirable) free field frequency response become “unequalized” upon deployment (typically as part of a larger sound system) for reasons beyond the scope of this discussion. However, those who use analyzers resort to their computer screens to identify the changes the loudspeaker (or sound system) have undergone in order to potentially “equalize” those changes where applicable.
Today’s FFT (fast Fourier transform) analyzers provide so much resolution (especially compared to real time analyzers – RTA – with only third-octave resolution) that users, out of the gate, typically resort to gratuitous amounts of smoothing to even out the responses in an attempt to make sense out of the madness.
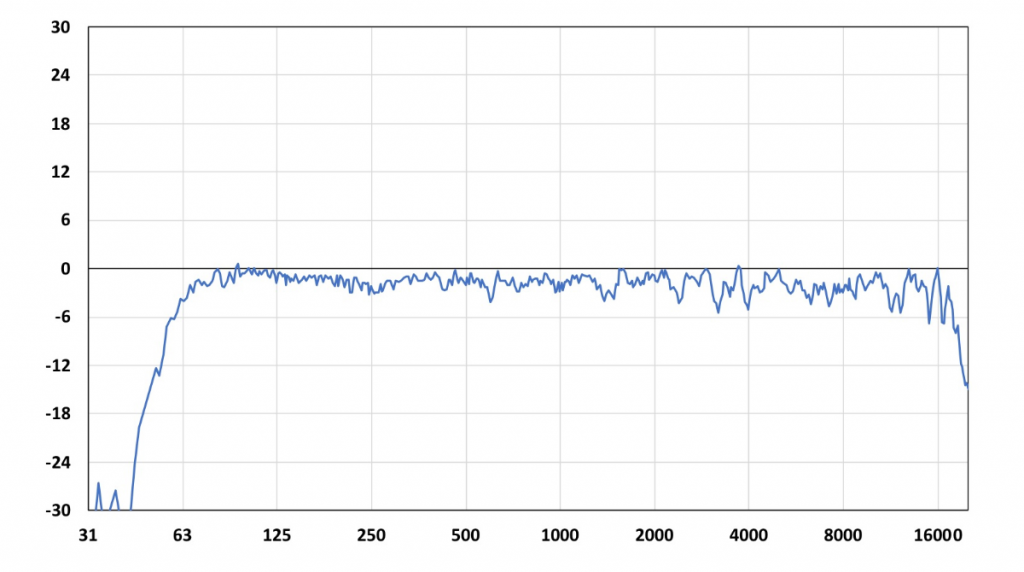
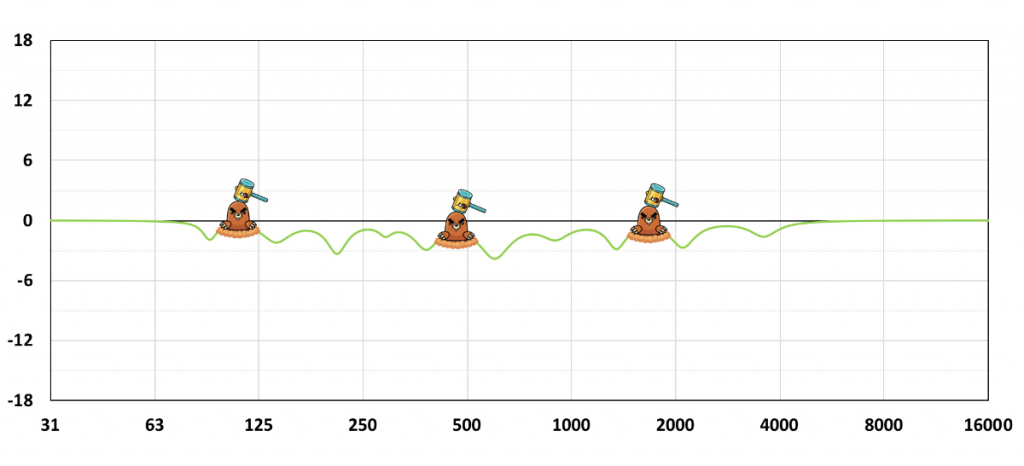
However, all that detail such as ripple, prior to smoothing, is not necessarily bad. Did you know that loudspeakers are expected to exhibit ripple, even under “ideal” circumstances such as an anechoic room (Figure 1)?
If I were to show you the edge of a razor blade under an electron microscope, you’ll likely never shave yourself again even though it’s a perfectly good razor blade that’s “razor-sharp.” As in medicine, we should apply the principal precept of “first, do no harm” because not every detail we see on an analyzer justifies intervention (Figure 2).
Survey
A while ago I reached out with a survey to my followers on Facebook, with this question: “Is the signal-to-audience ratio, i.e., sound system loudness with respect to audience noise, expected to change the transfer function during a live concert?” The majority of respondents (two-thirds) answered yes, and if they’re correct, it would suggest that sound systems are “re-equalized” when the audience is quiet or loud.
We know this isn’t true unless we invoke a change such as actual EQ. So what could have led these audio professionals to conclude that transfer functions change with audience enthusiasm (or lack thereof), which would suggest a different sounding system (psycho-acoustic phenomena such as masking excluded)? It’s an important question in the interest of eye-to-ear training if we want to measure what we hear and hear what we measure.
Noise
Provided you understand a transfer function, Figure 3 should make you appreciate that audience sound effectively translates into uncorrelated noise, independent of how the mix or sound system sounds, where the signal-to-noise ratio (SNR) is a balancing act between a sound system and audience loudness.
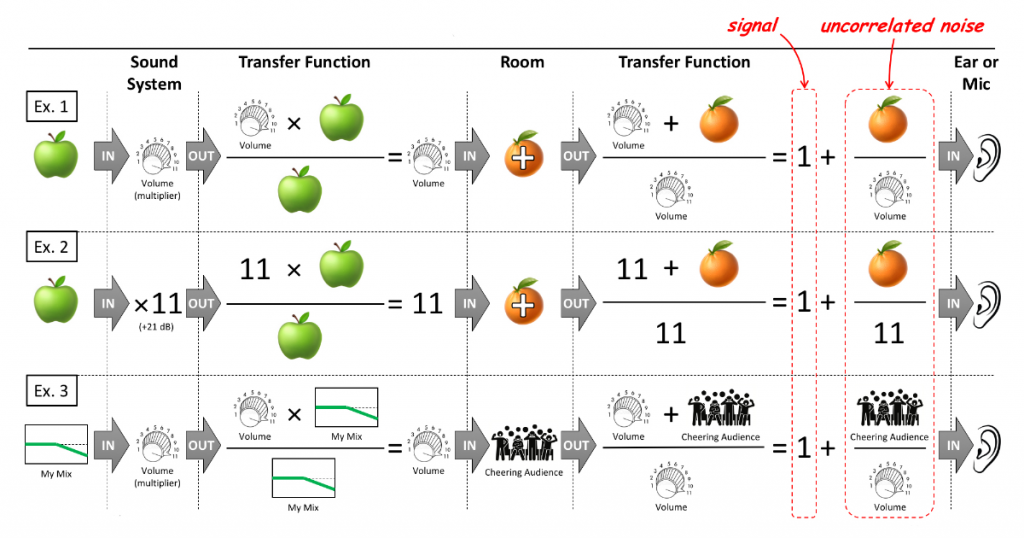
During a live concert, audience noise (among other things) can alter the appearance of a transfer function depending on how the analyzer is set up. Therefore, it’s in our best interest to understand these settings and how they affect the transfer function’s appearance so we can deliberately refrain from using EQ (do no harm), because audience noise doesn’t “unequalize” a sound system.
Averaging
Imagine being in a crowded bar, struggling to have an intelligible conversation because of “cocktail party” chatter and loud background music. In such a scenario, it’s not uncommon to ask someone to repeat him- or herself rather than resorting to shouting, which is a brute force attempt at increasing SNR. With each repetition you’re likely to gain another missing piece of information, such as another syllable or consonant, because the background noise is random, whereas pieces of information that were already successfully received are being reconfirmed.
When repeated enough times you’ll be able to ultimately reconstruct the complete sentence and the message is finally received. As long as the message stays consistent with each repetition, enough of them should ultimately allow you to overcome the background noise.
Analyzers, when set up correctly, offer similar functionality, where each doubling of the number of averages translates into a 3 dB boost in SNR without actuality cranking up the excitation signal level by brute force. Each time the number of averages is doubled, twice the amount of correlated data (the excitation signal) is captured, making signal gain 6 dB more market share.
Irrevocably, each time the number of averages is doubled, also twice the amount of contaminating uncorrelated data (noise) is captured. However, doubling uncorrelated data (unlike correlated signals) only results in a 3 dB increase. Therefore, the net increase in SNR equals the 6 dB signal boost minus the 3 dB noise boost, leaving 3 dB in favor of signal-over-noise for each doubling of averages.
Increasing the number of averages can artificially suppress the noise (floor) without raising the excitation signal level with brute force, provided you choose the correct type of magnitude averaging. Magnitude averaging can be performed in two vastly different ways (or types) called RMS and vector averaging, which can (and are likely to) affect the transfer function’s appearance to a great extent.