This brings us to coherence. Noise and distortion on separate tracks do not add coherently.
If you record the same mono guitar part on two analog tape tracks at once, when played back, the signals combine to give 6 dB more output.
But the tape noise is different on each track and so rises only 3 dB.
This is the same as using a tape track that’s twice as wide, or the difference between 8 tracks on half-inch tape versus 8 tracks on one-inch tape.
Figure 4 shows this in context, where recording the same source to two tracks at once yields a 3 dB improvement in the signal to noise ratio. The same thing happens with distortion. The distortion added by a preamp or converter on a bass track has different content than the distortion added to a vocal track.
So when you combine them cleanly in a mixer, the relative distortion for each track remains the same.

Thus, there is no “stacking” accumulation for distortion either. If you record a DI bass track through a preamp having 1 percent distortion on one track and then record a grand piano through the same preamp to another track, the mixed result will have the same 1 percent distortion from each instrument.
Myth-Information
One key to identifying many audio myths is the high prices charged. Another is the lack of any supporting data. It’s one thing for a vendor to claim improved sound, but quite another to prove it. If one brand of speaker wire really is better than all the others, it can be easily proven using the standard four parameters.
When a vendor offers flowery wording instead of test data or says only “Just listen,” that’s a pretty good sign that the claims are probably not truthful. I imagine some vendors actually believe their own claims! But that’s irrelevant. What really matters is that you know how to separate truth from fiction.
Many of the myths I’ve described do have a factual basic in science, but the effects are so infinitesimal that they can’t possibly be audible. I often see “subjectivists” proclaim that science has not yet found a way to identify and measure things they are certain they can hear, such as a change in sound after a solid state power amp has warmed up for half an hour.
I’ve also heard people state that audio gear can measure good but sound bad, or vice versa. But if a device measures good yet sounds bad—and sounding bad is confirmed by a proper blind test—then clearly the wrong things were measured. This is very different from the belief that what is heard as sounding bad (or good) can’t be measured at all.
In truth it’s quite the other way around. We can easily measure digital jitter that’s 120 dB below the music, which is a typical amount and is about 1,000 times softer than could be audible. It’s the same for distortion, frequency response, and noise, especially when you factor in the ear’s susceptibility to the masking effect.
Many audiophiles truly believe they hear a change in quality when science and logic suggest that no audible difference should exist. But this is easy to disprove: If there were more to audio than the four basic parameters, it would have been revealed by now as a residual in a null test.
Hewlett-Packard distortion analyzers going back to the mid-twentieth century use nulling to remove the test signal and reveal any artifacts that remain. The beauty of nulling is that it reveals all differences between two signals, including distortion or other artifacts you might not have thought to look for.
The Big Picture
Keeping what truly matters in perspective, it makes little sense to obsess over microscopic amounts of distortion in a preamp or computer sound card, when most loudspeakers have at least ten times more distortion.

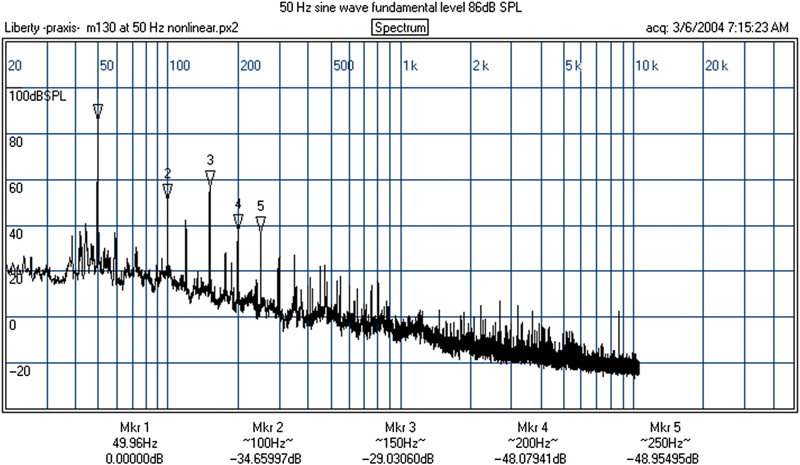
Figure 5 shows the first five individual components measured from a loudspeaker playing a 50 Hz tone. When you add them up, the total THD is 6.14 percent, and this doesn’t include the IM sum and difference products that would also be present had there been two or more source frequencies, as is typical for music.
Midrange and treble speaker drivers often have less distortion than woofers, mostly because woofer cones have to move much farther to create similar volume levels. But even high-quality tweeters playing at moderate volumes typically have more distortion than modern electronic devices.
Summary
This chapter explained the four parameter categories that define everything affecting audio fidelity, as well as important specs that vendors sometimes hide, and ways vendors skew data in published graphs to appear more favorable. We also busted a number of common audio myths and learned the correct terminology to define fidelity.
The quality of audio gear can be measured to a much higher resolution than human ears can hear, and those measurements are more accurate and reliable than hearing. Although transparency can be defined and determined conclusively through measuring, color is more difficult to quantify because it involves preference, which cannot be defined.
Likewise, degradation caused by lossy MP3-type audio compression is difficult to measure because it doesn’t lend itself to traditional fidelity tests. Even with bit-rates high enough to not audibly harm the music, a null test will always reveal residual artifacts.
In that case, blind tests—requiring many trials with many test subjects—are the only way to assess how objectionable the lossy compression is for a given bit-rate. But there’s no magic, and everything that audibly affects electronic gear can be easily measured.
Ultimately, many of these are consumerist issues, and people have a right to spend their money however they choose. If Donald Trump wants to pay $6,000 for an AC power cord, that’s his choice and nobody can say he’s wrong.
Further, paying more for real value is justified. Features, reliability, build quality, good components, convenience and usability, and even appearance all demand a price.
If I’m an engineer at Universal Studios recording major film scores, which can cost hundreds of dollars per minute just for the orchestra musicians, I will not buy the cheapest brand that could break down at the worst time, no matter how clean it sounds.
Further, even if a device is audibly transparent, that doesn’t mean it’s “good enough,” and so recording engineers and consumers won’t benefit from even higher performance.
Audio typically passes through many devices in its long journey from the studio microphones to your loudspeakers, and what we ultimately hear is the sum of degradation from all of the devices combined. This means not just distortion and noise, but also frequency response errors. When audio passes though five devices in a row that each have a modest 1 dB loss at 20 Hz, the net response is a 5 dB reduction at 20 Hz.
The goal of this chapter is to explain what affects audio fidelity, to what degree of audibility, and why. But one important question remains: Why do people sometimes believe they hear a change in audio quality—for example, after replacing one competent wire with another—even when measurements prove there is no audible difference? This long-standing mystery will be explored fully in Chapter 3.
“The Audio Expert” by Ethan Winer, published by Focal Press (ISBN: 9780240821009), is available here. Also be sure to read Part 1: Audio Fidelity, Measurements, And Myths and Part 2: Lies, Damn Lies, and Audio Gear Specs.

