Part 1 and Part 2 of this series show significant variations between the subwoofer array curving algorithms implemented in different simulation software. It was shown that the quantified performance of the reproduced sound field strongly depends on the chosen algorithm. To put this into practice, this article summarises the results of a comparison between simulated and measured data.
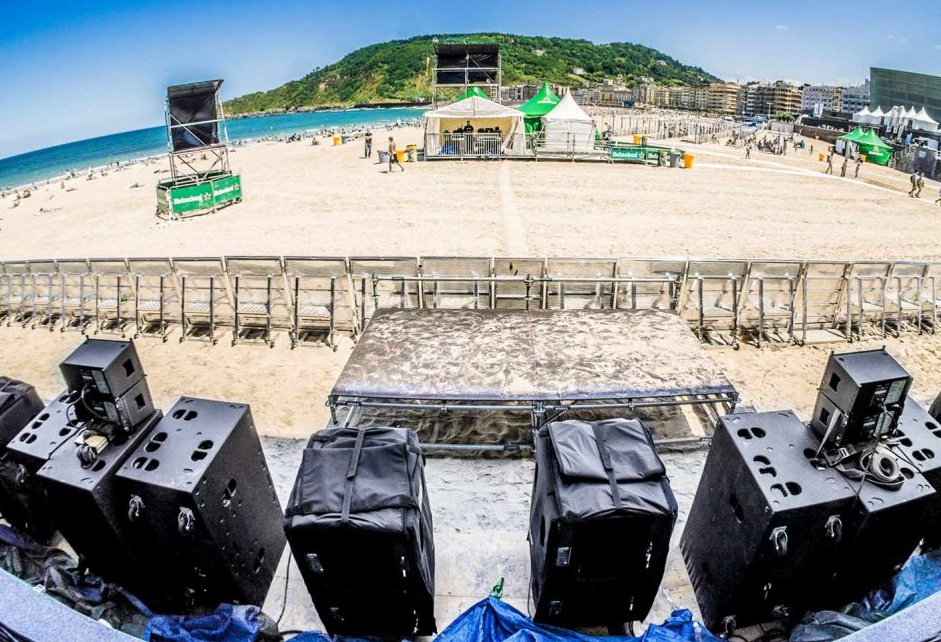
The field test was carried out in a large open space of a conference center. An audience area of 50 by 40 meters is covered by an example array of 12 elements with single 18-inch subwoofers (see Part 2). To measure the sound radiation of the array, the transfer functions are measured and analysed for different curving parameters at 55 points located on one half of the audience. The measurement positions are in the near and far field of the array as well as behind, and outside, the audience zone to evaluate the sound emission to residential areas. To compare simulation and measurement, the sound field is simulated and interpolated with the same grid points. First, the results are analysed without any processing (ZeroConfig) and afterwards with the parameters of SW1 and SW3 representative for the other algorithms.
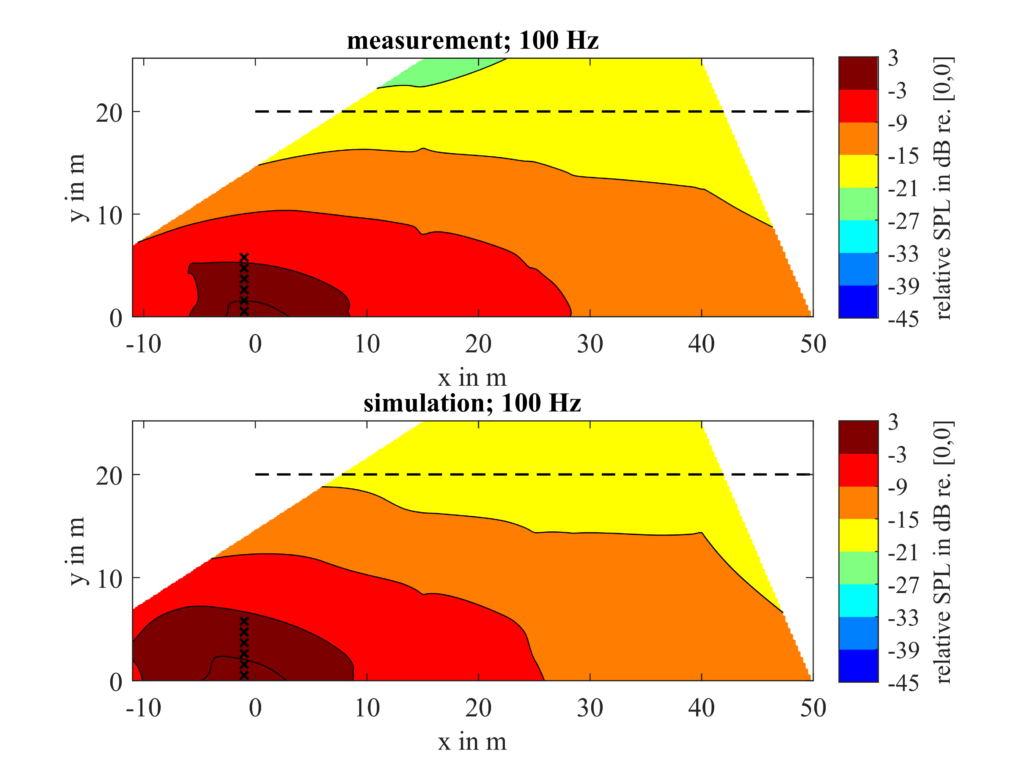
Figure 1 shows the mapping of the measurement data in comparison to the simulation on one half of the audience zone for the ZeroConfig at 100 Hz. No measurements were taken in the white areas. The dashed line represents the boundary of the audience zone.
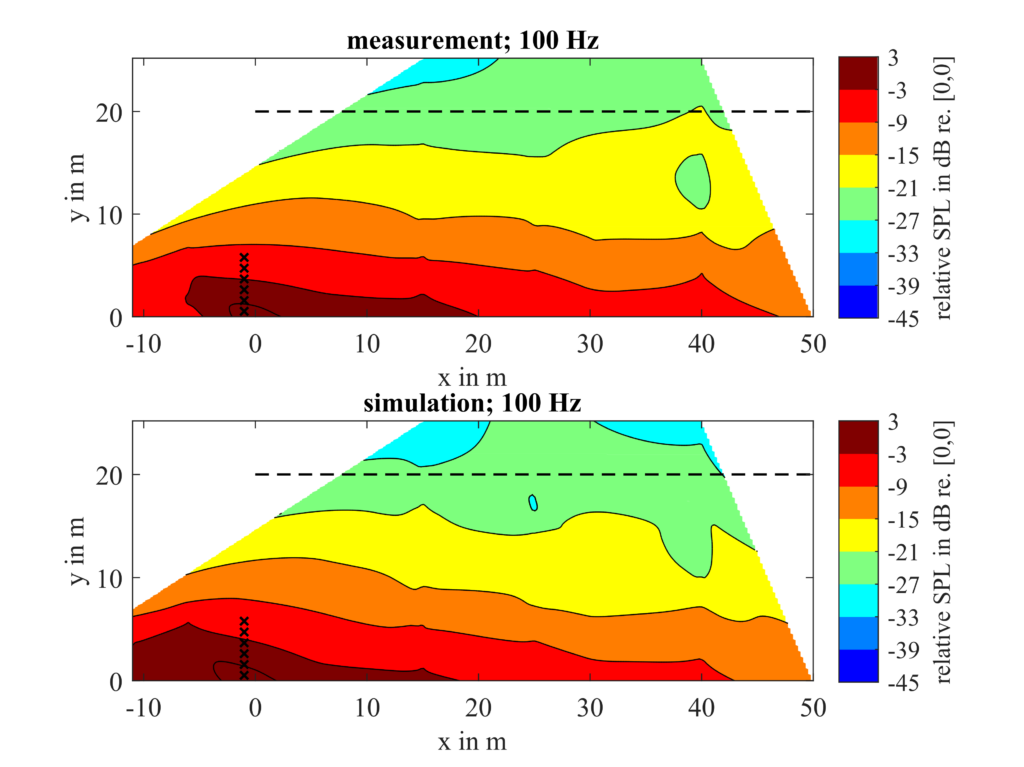
The two mappings correspond well and show an accurate prediction. Finer structures in the radiation pattern, especially in the near field of the array, are not shown in such detail due to the limited number of measurement points. The area behind the array was measured with a higher resolution to estimate the sound pressure level on a stage, which is why the dispersion behaviour seems to be slightly wider there. Up to 2 dB less sound pressure level can be expected behind the system in comparison to the simulations.
Good accuracy can also be seen in the lower frequency range at 40 Hz. Figure 2 displays the results for the curving parameters of SW1 (shorter delay times).

As expected, the main lobe is wider compared to the ZeroConfig. The nominal opening angle required to cover the entire audience may be a little underestimated. The edges of the main lobe remain in the listening area so that the sound pressure outside is low. When analysing the same approach at higher frequencies in Figure 3, the directivity of the individual loudspeakers results in an even narrower main lobe than in the simulation.
It directs the energy forward, resulting in a longer throw. The effect can also be experienced in practice. The sound pressure at FOH (25 m) decreases significantly at about 15 m off-axis, whereas the audience zone ends at 20 m off-axis.
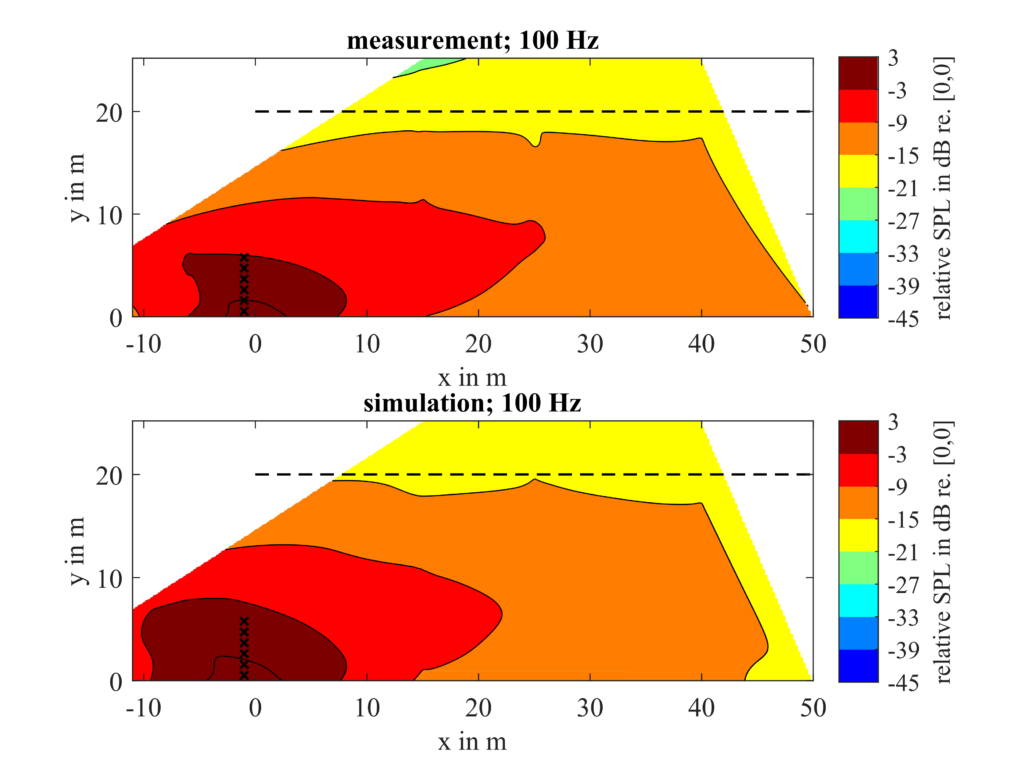
Figure 4 shows the sound field with the parameters of SW3 at 100 Hz. The approach was characterised by longer delay times that increase faster towards the outer elements. In the simulations of Part 2 it is shown that the main lobe is separated in this frequency range. This results in a lower sound pressure level at front of house in the center of the audience. The phenomenon is also observed in the measured data. The dispersion pattern is wider compared to Figure 3 and reaches further to the edges of the audience. The perceptual transition to the sides and the level drop are smoother compared to the parameters of SW1.
To quantify the deviation between measurement and simulation and to evaluate the performance metrics in practice, the mean spatial variance SV is calculated for all measurement points in the audience zone (Table 1). For this purpose, the transfer functions are normalized.

Also for this data, the delay parameters of SW1 provide the best consistency across all points. The difference between measurement and simulation is less than 0.5 dB for all three tests. This means that SV can be used as a single value to quantify the consistency in the audience for practical applications. The values are higher compared to the results of the simulations in Part 2, which is due to the limited number of measurement points and their location in the audience.
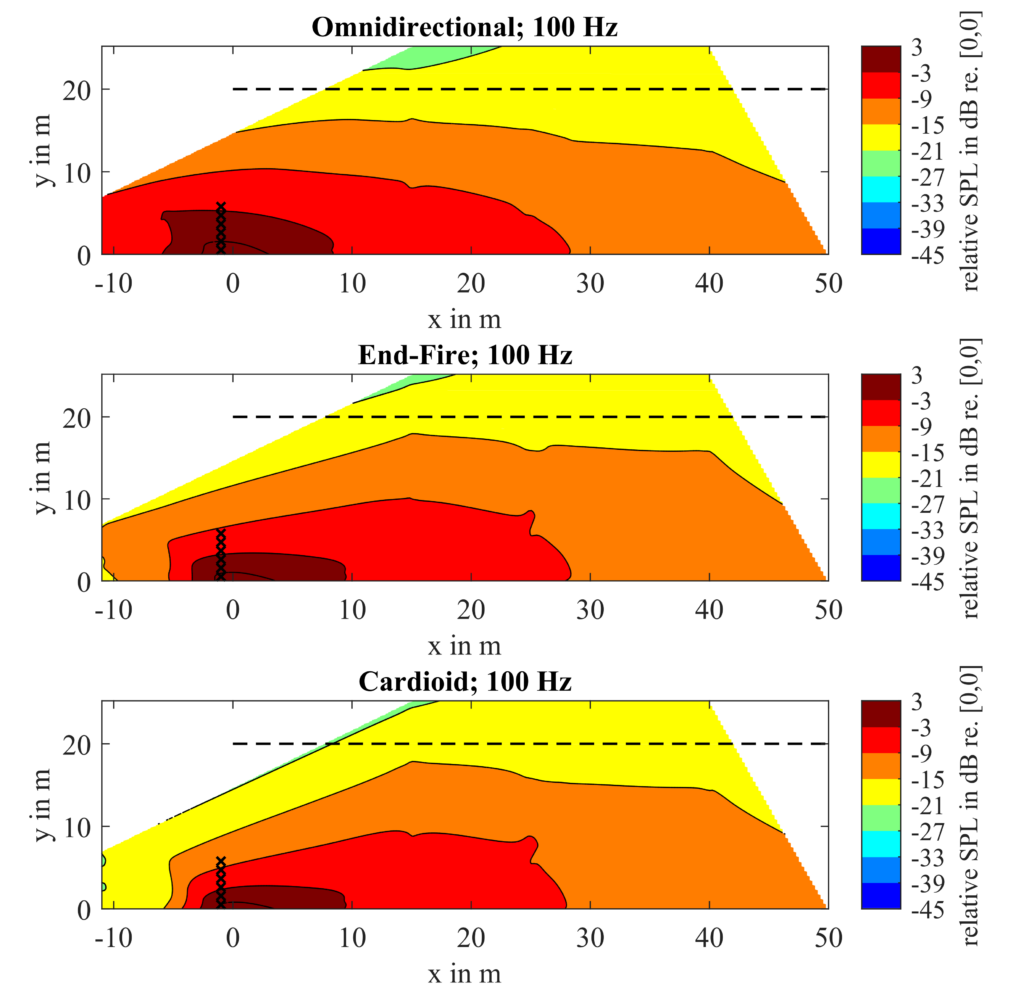
In further tests it could be shown that a system configuration as cardioid or end-fire does not influence the objective consistency metric that much. With these configurations, the system designer should be aware that the dispersion pattern of the array is even more narrow in the higher frequency range due to diffraction effects and sound energy radiated from the rear facing drivers to the front. These effects have less influence in the far field. There, omnidirectional and directional system setups have a similar radiation (Figure 5). The measured front-to-back attenuation at a distance of 10 m is 12 dB for the cardioid, 5 dB for end-fire and 1.8 dB for the omnidirectional configuration on average over all frequencies.
Conclusion
Simulations for subwoofer arrays with a simple point source approach are only accurate for the lower frequencies of the operating range. At higher frequencies, diffraction effects and an increasing directivity of the individual elements, narrowing the dispersion pattern of the entire array system. To compensate for these effects, the energy in these frequency ranges can be directed by tilting the outer elements. Only one software algorithm offered this option.
Furthermore, it shows that it is insufficient to calculate the sound field only with a point source approach. The frequency-dependent complex directivity of the individual elements should be used for simulation to improve the accuracy (1). When using array systems, boundary effects and diffraction also lead to a lower sound pressure level behind the array in reality compared to the simulation. These effects are mostly not included in simulation environments. The measurements show that a subwoofer arc configuration provides a very good control over horizontal directivity, which is consistent with the results of the simulations and other publications (2).
All delay algorithms investigated lead to a more homogeneous sound pressure level distribution in the audience zone. Most of them are based on a circular approach. These lead to longer delay times with a faster increase to the outer elements. The resulting sound pressure on-axis is lower and local gaps in the main lobe may occur.
The same results also apply to a mostly linear approach. The simulations and tests have shown that a more elliptical profile with a shorter delay and a progressive slope towards the outer speakers is more efficient and provides less variation across the audience. Sharp coverage edges improve noise emission to the outside. Defining the coverage angle correctly is very important to optimise coverage for a specific audience zone. Depending on the algorithm, the nominal opening angle may be under- or overestimated.
An objective metric can help to quantify the performance of the configuration and find the best processing parameters. For an accurate system design, these insights should be incorporated throughout the design and alignment process to achieve the best overall system performance.
The tests and analyses would not be possible without the support and help of the people and companies mentioned below. My thanks to them:
• Soundlight l.e. for the supply of the material, the truck and organizing me access to the former exhibition center in Leipzig.
• Rational Acoustics for supporting to analyse this large amount of measurement data and facilitating the process.
• TW AUDiO for supporting throughout the process and providing the measurement system.
• Adam Hill for providing feedback and input regarding the performance metric.
• Alexander Goldmann for his hard work and good company in carrying out all the measurements.
(1) Feistel, S. (2013). Modeling the Radiation of Modern Sound Reinforcement Systems in High Resolution (Dissertation, RWTH Aachen University).
(2) Mouterde, T. & Corteel, E. (2021, October): On the comparison of flown and ground-stacked subwoofer configurations regarding noise pollution (Convention Paper). Audio Engineering Society Convention 151, Las Vegas and Online.