
If one could listen to only the direct sound of a loudspeaker, the world would be a very different place!
Unfortunately, free field listening, where you have no reflections, room modes or ambient noise, is hard to achieve in everyday life, so we listen to loudspeakers in real rooms. The interaction of a loudspeaker system and a room can be very complex to understand, model or measure.
One way to measure this interaction is to measure the impulse response of the loudspeaker/room system. The impulse response of a typical sound system in a room contains lots of interesting information, including:
1) The delay between the loudspeaker and measurement microphone
2) The direct sound-to-reverberent level ratio
3) The time arrival, frequency content and level of reflections of sound
4) The early and late decay rates of the sound
5) The frequency response of the direct sound.
This last point is particularly interesting. The question is “What do we want to measure and why?”
One question that goes to the heart of “system” measurement and optimization issues is “If the impulse response contains the frequency response of the direct sound, can we separate the loudspeaker response from the room response?” Also “If we can, do we want to?”
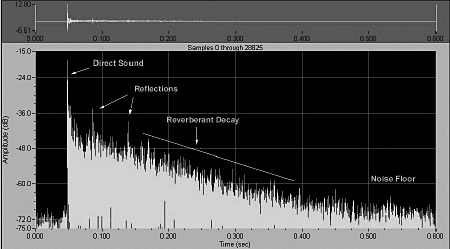
Figure 1 shows an impulse response of a 1,250-seat multipurpose hall. displayed in the time domain. The x-axis is time (~0.75 sec) and the y-axis is magnitude in dB. Note the direct sound, reflections, the reverberant decay and the noise floor.
The “spike” that represents the direct sound actually contains the frequency and phase information about the loudspeaker. To see this information we must transform this portion of the impulse response into the frequency domain.
To achieve this isolation of the direct sound from the room response, we must select a time window that includes the direct sound but excludes the reflections and decay of the room.
Figure 2 displays such a time window. This measurement, in the same 1,250-seat hall, was made using a full-range loudspeaker system with the microphone approximately 60 feet from the loudspeaker. Pink noise was used as a reference signal and the impulse response was calculated using a 512K FFT (although only the first ~0.75 seconds are shown).
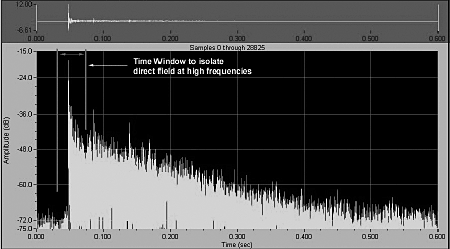
The vertical lines suggest a time window that ignores most of the effects of the room at frequencies whose periods are longer than the time window (i.e. low frequencies).
We can take the “time windowed” data and transform it into the frequency domain using FFT mathematics. This transformation yields a result that shows how much energy is present at each frequency, demonstrated in Figure 3, showing the frequency response of the direct sound portion of an impulse response in the 1,250-seat hall.
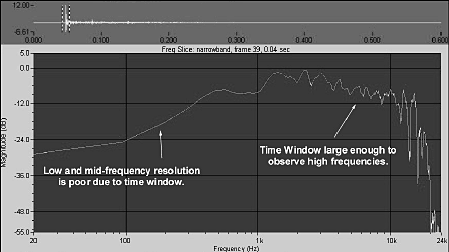
The response was calculated using a 512 point FFT (which equals a 512/48000 or ~11 msec). As you can see the frequency response shows a pronounced LF roll-off. You can also notice the lack of LF resolution in this figure. The lack of resolution at LF is offset by a excess of HF resolution.
This uneven resolution between LF and HF energy is the result of the FFT mathematics used to transform the data from the time domain to the frequency domain. Standard FFTs yield data that is distributed linearly in frequency (one data point every X Hertz). Unfortunately, humans perceive frequency logarithmically.
This lack of LF resolution in Figure 3 is a direct result of the use of a short time window in our transformation from the time domain to the frequency domain. It is interesting to note that this plot does not correlate with what we hear. Simply listening to the full range loudspeaker system we were measuring made it clear that the system was reproducing LF energy down to at least 100 Hz!
I would suggest that a primary goal of an effective measurement system should be to provide results that correlate well with what we hear. So the lack of correlation between what we have heard and what we measured suggests a modification to our approach.
As an alternate approach to trying to find a measurement that correlates with what we hear, we can try using a longer time window to “see” the LF response with better resolution.
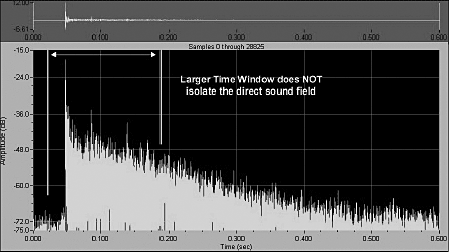
A longer time window of approximately 250 msec is depicted in Figure 4, showing the impulse response in the 1,250-seat multipurpose hall. The vertical lines suggest a time window that includes most of the effects of the room. The time window shown is approximately 0.25 seconds.
To transform this longer “slice” of the impulse response into the frequency domain, we will use an 8k FFT which represents 8k/48000 seconds, or 0.171 seconds.
Notice again that this time window includes both the direct sound and the response of the room.
Figure 5 shows the frequency response of the direct sound portion of an impulse response of the 1,250-seat hall. The response was calculated using a 8192 point FFT (which equals a 8192/48000 or ~107 msec). As you can see, the frequency response shows low-frequency energy that is much more pronounced than seen with the shorter time window.
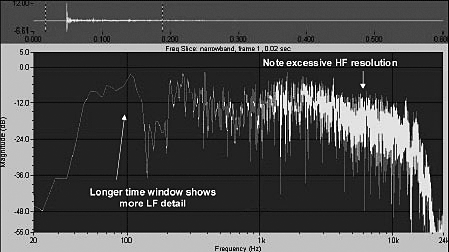
While the low-frequency information is seen in adequate resolution, the high frequency results look confusing. The plot shows data that has 5 Hz resolution (i.e. one data point every 5 Hz). While this resolution provides excellent LF resolution (between 31 Hz and 62.5 Hz there are 15 data points.
However, at HF we have excessive resolution—between 4 kHz and 8 kHz there are approximately 800 data points. Simply stated, the longer time window provides good LF resolution, but excessive HF resolution.
The result of studying these plots might lead you to conclude that in order to make measurements that correlate well with our listening experience, we must use very short time windows that isolate the direct sound at high frequencies, and increasingly longer time windows as we look at lower frequencies. At first glance this idea might seem to violate the often quoted phrase, “One can only affect the direct sound with processing.”
However this is not the case. At mid-low and low frequencies, the interaction of a sound system and a room can be affected and optimized by signal processing. In other words, at low frequencies (long wavelengths) the direct sound and reflections from nearby surfaces combine to form a composite response. It is this composite response that a listener hears.
The ability to measure several time windows simultaneously provides a measurement that both correlates well with human hearing and provides insight into how the signal being sent to the loudspeaker can be tailored (via equalizers, or other processing) to optimize the loudspeaker/room interaction.
The last figure shows a measurement of a loudspeaker system that includes multiple time windows and displays both the magnitude and phase response of the “system.” The use of multiple time windows allows one to isolate the direct sound of a loudspeaker in a real-world situation at high frequencies.
However, at lower frequencies, longer time windows that include the loudspeaker/room interaction have been found to correlate well with our listening experience. Multiple time windows in a single measurement is an extremely interesting way to measure and optimize the response of a sound system in a room.