
This adventure starts about 14 years ago. It was then that a customer complained that a new projection system I specified was not “bright enough”. He asked how I determined what projector to specify. Remember, this was back at a time when cost-effective LCD projectors were just beginning to reach 3,000 ANSI lumens.
My answer to him was weak. I really didn’t calculate anything. Given the screen size they needed, I just specified the brightest XGA projector they could afford.
When I saw the image for the first time I had to agree with him. It looked dim and washed out. Ultimately, the problem was resolved when our service manager found a bad connection on one of the extender cables that had been installed. Once the termination was repaired, the image came to life and was acceptable to all.
The Journey
That event sent me on a mission to figure out a better way to objectively quantify my projection designs. I figured this would be fairly easy to do. Surely, the leading projector or screen manufacturers would have calculators on their websites, or at least have some specific information relating to “industry standards” for brightness and contrast. Oh my, was I wrong.
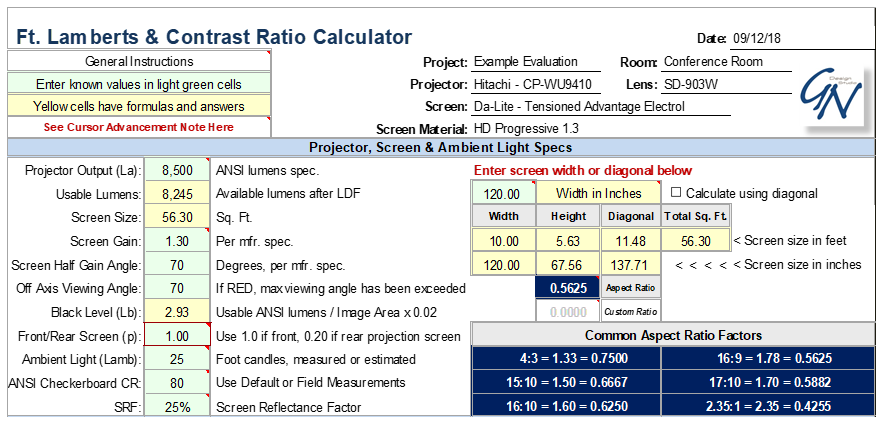
There are many details to factor when calculating for brightness and contrast. They include screen size, available projector lumens, usable projector lumens, aspect ratio, screen gain, black level, front vs. rear projection, throw distance, and ambient light.
It took about a year of research, in my spare time, to cobble together fragments of information, which came from all corners of the industry. I was looking for consistent ideas and direction, target values and formulas, but I couldn’t find much. I gathered a little from each of the major projector and screen manufacturers, from standards organizations such as ANSI and SMPTE, and anything else I could find. As recently as a few years ago, actual guidelines and formulas were few and far between, unlike today’s AVIXA Image System Contrast Ratio standard.
The Goals
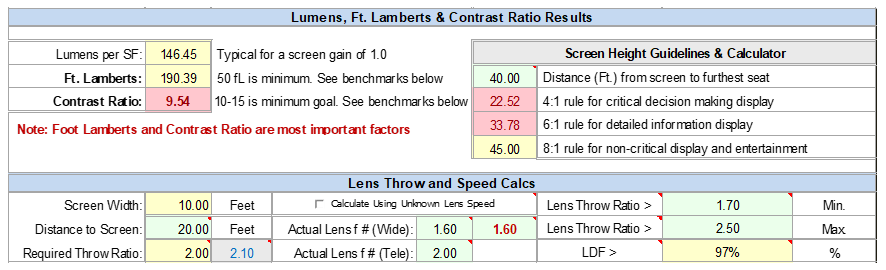
As I came to learn, the two key elements are Foot Lamberts (FL) and Contrast Ratio (CR). FL being the amount of light that is reflected off a screen – or through, in the case of rear projection — and to the viewers eyes. CR is the ratio between the brightest color (white) and the darkest color (black) that a system is capable of delivering. I now knew what to look for, but I couldn’t find any published data describing how much of each was needed.
So, what are the objective goals for FL and CR? Based on my research and experience, a combination of 50 FL or more AND a CR of 15:1 or greater, will deliver a very good image under well controlled lighting conditions. If you have a reasonably sufficient budget, these goals aren’t too hard to achieve with today’s technology.
There are two obvious exceptions to the 50/15 guidelines: First, is in a darkened room or theater. There, a good CR value is much easier to achieve.
Second, is a scenario where significant ambient light surrounds the screen; think large windows. When this situation occurs, human eyes can’t voluntarily isolate on the projected image. In general, if the background light is brighter than the projected image, your pupils constrict, allowing less light in, and the viewing experience is significantly degraded.
If faced with this type environment, arrange for an in situ demo, and advise the customer that they will either have to install and close blinds or drapes, or throw a great deal of money at screen and projection technology to overwhelm the bright, ambient backlight.
The Application
I’ve had a long-standing love affair with spreadsheets, going back to the early days of Quattro Pro. To me they blend art and science; here math elegantly meets graphic design.
I began to heuristically connect the dots, plugging various formulas into my first projection calculation spreadsheet. The plan was to figure out a way to incorporate all the factors, as I understood them at the time, into an interactive tool that was flexible enough to get quick, useful results.
Over the years, new insights, products, standards and experiences have pushed me to update the spreadsheet several times. My Projection Calculator (v5.4) is by far the best, most accurate and complete version of those efforts. It’s also the one that best incorporates two sub-components I didn’t fully understand and appreciate until just a few years ago — lens dimming factor (LDF) and lens speed (f).
How Are LDF And f Related?
LDF is a subtle but important component in the FL and CR calculations. Simply put, LDF is a variable reduction in projected light that is defined by the required throw ratio of the lens.
All zoom lenses have (or should have) two published throw ratio limits. The smaller number is the widest (short throw) end of the zoom, the larger number is the tightest (long throw) end. Ratios such as 1.7 – 2.5 are often representative of a projector’s “standard” lens.
In addition, each zoom lens has a speed range that is given as two “f” numbers. At the widest end of the range the f number is smallest. It is largest at the long-throw end. Also, a projector’s “standard” lens usually has the fastest optics. Fixed, short-zoom, and longer zoom lenses almost always have a higher (slower) range of f numbers than the standard lenses.
Throw Distance Matters
Light loss is directly affected by the throw distance. Lens theory tells us that the greatest amount of light passes through a projection lens at the short-throw end of its range, while less and less light passes through as we move towards the long-throw end, thus reducing the usable light being produced by the light engine.

The throw ratio and lens speed are interdependently locked together. As a lens tracks through its range of focal lengths, it simultaneously tracks through its range of lens speeds. This happens at different rates because the throw ratio boundaries and the lens speed limits are almost never on the same scale. Example: you are not likely to see a throw ratio and lens speed that are both listed as 1.8 – 2.4. Usually the lens speed limits are tighter than the boundaries of the throw ratio.

Based on the required throw ratio, the spreadsheet application calculates (as a percentage) the point along the range of “zoomability” (I can’t resist making up technical terms where none exist) where the lens will be used. It then factors a correlated percentage of the f range, so it can effectively de-rate the available lumens as the throw ratio increases.
Manufacturer Specs
Manufacturers are not consistent or standardized with their testing methods. The most reliable metric is found when ANSI lumens are derived using their standard lens, set mid-way between the throw-ratio extremes. However, some manufacturers test their projectors using the best case scenario in their lens lineup; their fastest, widest option. This usually appears at the wide end of their “standard” zoom lens. The only way to tell which method was used is to contact the company and ask.
Plugging in the appropriate speed values would be much easier if the various manufacturers actually published the f number for each of their lenses. Few do. Hitachi (now Maxell) and NEC were the most forthcoming I could find online.
It’s interesting to note even today, none of the major projector manufacturers seem willing to address the two key elements (FL and CR) in their projection calculators. They’re all happy to help with basic projection geometry, but that’s the easiest part of the designer’s work.
Does Any Of This Really Matter?
The main reason all these things matter is this. It gives the designer and customer confidence that the specified projection system is nether too much nor too little for the desired application. It helps the customer trust they are spending an appropriate amount of money to get a high-quality image. I think this is the goal of all concerned, and the true value of my application.
If you would like a copy of the Excel spreadsheet, it can be found on my website here.
There are a minimum of nine data cells that must be used to properly calculate for FL and CR, and seven more that can be used to provide even more accuracy, if the appropriate data values are input.
To help guide you through the process, there are many informative and instructive fly-offs embedded in the spreadsheet. You’ll see these notes when you place your cursor over the various cells. Please take the time to read each at least once.
Hopefully, you’ll find that this application provides all the tools necessary to make well-informed projection decisions.
A Final Note: This is a projection system modeling application. It is not brand specific. AV system designers are often required to specify projection systems without the benefit of having actual, field-conditions data available. This application was initially developed — with ongoing refinements — to help the designer work through various scenarios in order to find the best, most cost-effective projection solution.
Disclaimer: There are no perfect, interactive algorithms for calculating FL and CR values. This application should be used as a practical planning guide with these tolerances in mind. Best case: +/- 10%. Worst case: +/- 20%. This application offers no guarantees. For highest accuracy – mock up, test and measure results under real-world conditions.