
Over the years, many have debated the relative merits of “looking at screen traces” on an analyzer versus using human hearing to determine how a loudspeaker, or an entire system, actually performs. While both practices are valid, of course, it’s extremely difficult for the human ear to detect, characterize, and correct small deviations in frequency and phase response, and even harder to characterize driver distortion in a meaningful manner.
Likewise, the ear is often stymied when attempting to typify transient response across the spectrum. This is particularly true in the lower frequencies where slow cone acceleration and deceleration can produce a bigger, warmer sound – dependant (of course) on the program material, the room acoustics, and the listener’s perception.
By listening, we all can tell if a system sounds ragged and distorted; we know when a system is bass heavy or too trebly; we usually know when a note or two stands out unnaturally. But unless we play long passages of music in many different key signatures, it’s all too easy to miss the problem of uneven frequency response, especially if it’s confined to a narrow bandwidth.
And unless we’re willing to subject our ears to varying levels of distortion at high sound pressure levels (bad idea!), it’s nearly impossible to characterize the distortion products of a given driver, or loudspeaker system, in relation to other drivers and other loudspeaker systems.
Finally, if we haven’t trained our ears to a super-human level, we’re going to have an extremely hard time identifying gradual shifts in phase response, let alone what to do about them. This doesn’t mean that we aren’t able to hear the negative effects of distortion, frequency, and phase irregularity; what we’re saying is that hearing the problem is not the same as quantifying the problem and then developing a solution to correct it.
More Useful
While it’s never a good idea to ignore what you hear in favor of what you see on an analyzer display, the information that an audio analyzer can provide will help enormously whether your task is to optimize a sound system that’s already in place, EQ a simple pair of loudspeakers on sticks, or design a superlative loudspeaker system from scratch. And as I’ve pointed out in previous articles,an analyzer with narrow-band resolution is vastly more useful than a simple octave or third-octave portable device.
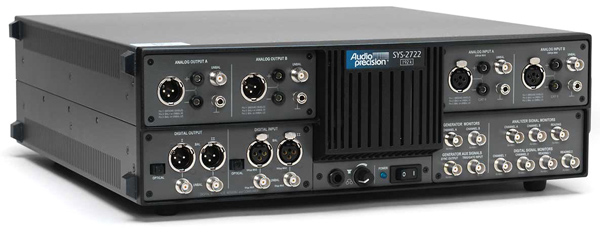
Let’s look at acquiring a distortion measurement as one important example of what an analyzer can do for you beyond just displaying a frequency response curve. Some analyzers offer distortion measurements as a built-in function, notably certain models manufactured by Audio Precision (Figure 1).
Distortion, in its many forms, is virtually always a function of signal level, but not always in a linear fashion. A linear device, such as a good quality pre-amplifier or power amplifier, will exhibit harmonic distortion products that remain at the same ratio to the test-tone fundamental signal – until the device becomes non-linear due to excessive level, at which time the harmonic distortion increases at a non-proportionate rate.
The distortion products of a well-designed loudspeaker may remain linear at a wide range of power levels, but it’s a safe bet that as maximum power handling is approached, most loudspeakers will exhibit non-linear, even runaway distortion response.
I’ve investigated low- and high-frequency drivers for many years; in some cases, as the driver comes close to burnout, the second and third harmonic distortion products actually exceed the level of the fundamental frequency that’s exciting the driver for the test. This equates to more than 100 percent distortion, counter intuitive as that may be.
Incidentally, when running such tests, it’s strongly advised to wear serious hearing protection, and even then, the sonic signature is anything but pretty.
A very useful routine that’s built into some analyzers for measuring distortion continually increments the drive level to the DUT (device under test) so that the operator can view the effect of level versus distortion versus frequency. This is important because measuring distortion at a single level or a single frequency won’t tell you much.
The distortion characteristics of an 800-watt woofer with 1 watt of power applied will not be the same as when 800 watts are applied. Nor will the harmonic distortion at 30 Hz be the same as at 100 Hz (hint: it will be significantly higher at 30 Hz and at 800 watts). The use of an analyzer will reveal these conditions without having to sacrifice your hearing by trying to determine them by ear.
Fighting Distortion
But what if you don’t happen to have an analyzer equipped with distortion measurement capabilities? Distortion can still be measured with an FFT (fast Fourier transform) or other narrow-band analyzer, but the process requires a bit more effort.
To make a harmonic distortion measurement, a low-distortion sine wave source is needed. If an analyzer doesn’t have a built-in adjustable-frequency sine source, an outboard generator can be used. Make sure that the sine wave generator is as pure and distortion-free as possible.
By applying a low distortion fixed sine wave to the DUT, and looking at the spectral content of the DUT, you can see the magnitude of the harmonics that are not present in the test signal. Since most loudspeakers produce one or two orders-of-magnitude greater distortion than most electronic equipment (amplifiers, pre-amps, etc), we’ll use a loudspeaker as an example. Figure 2 shows a typical screen commonly seen when viewing distortion on an FFT.
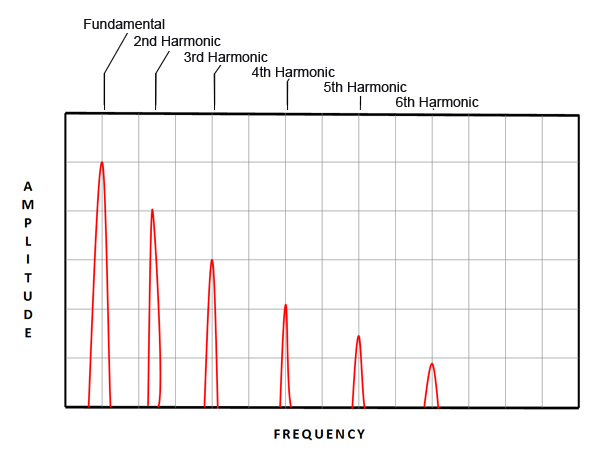
The fundamental tone from the generator is the tallest trace at the left of the screen. For this example, let’s say it’s set at 100 Hz. An ideal loudspeaker would reproduce only the 100 Hz tone and nothing more.
However, there are no perfect loudspeakers. So what is produced is a series of harmonics that are the loudspeaker’s distortion products. In other words, unwanted energy content that the loudspeaker is emitting but not being excited with.
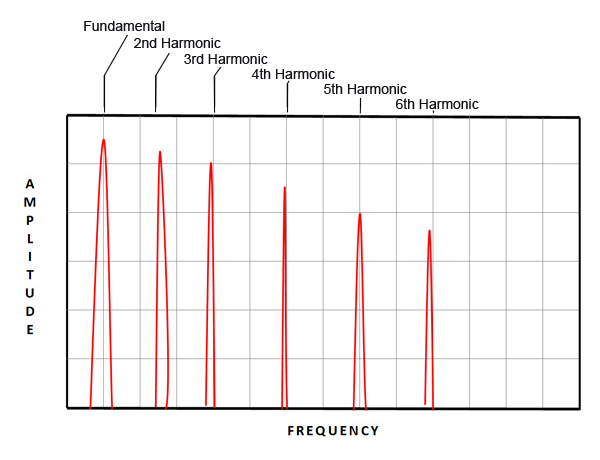
As the drive level to the loudspeaker is increased, the fundamental will increase in amplitude. If the loudspeaker is linear, the harmonics will increase proportionately. As the level continues to increase, and the loudspeaker eventually becomes non-linear, the amplitude of the harmonics will increase at a rate that is greater than that of the fundamental.
Figure 3 depicts the distortion signature of a loudspeaker that’s become significantly non-linear due to the power applied. If even more power is applied, the second and third harmonics may even exceed the level of the fundamental, and/or the loudspeaker will be damaged.
In order to properly characterize a loudspeaker’s distortion across the full spectrum that it’s intended to reproduce, measurements must be taken at many different frequencies. It’s better if they’re not octave-band related because the same problem (or lack thereof), usually stemming from some form of resonance, is likely to be repeated when the distortion products are harmonically related to a previous measurement.
In other words, once you’ve measured distortion at 100 Hz at various power levels, increase the frequency of the oscillator to 110 Hz, then 125 Hz, then 133 Hz, and so on, rather than jumping ahead to 200 Hz.
There is no hard and fast rule, but the greater the number of measurements taken, the better understanding you’ll have of the loudspeaker’s behavior. After spending a day or two doing this manually, it becomes quite evident that a distortion measurement routine, pre-programmed into a modern analyzer, can compress many hours of work into mere minutes.
Various Approaches
While this is slightly off-topic, methods do exist to reduce distortion once you understand how and why it’s being generated. With a LF loudspeaker, the enclosure’s tuning can be optimized for a specific task if it’s possible to alter the port area and port length.
If an application doesn’t need 25 Hz reproduction but demands a lot of power at 40 Hz, re-tuning the enclosure by changing the ports may reduce the distortion considerably at 40 Hz, and the transient response will probably improve too, as a byproduct.
Another approach is to use more PA than you might normally think is needed. The Grateful Dead were big on this concept, sometimes putting stadium-sized loudspeakers into small theatres. The reason this works is because most modern loudspeakers exhibit respectable distortion figures at low to moderate operating levels, but not necessarily when they’re being pushed hard.
Therefore, if the PA isn’t being operated at the upper end of its power output capability, then the sonic quality will likely be clearer and more natural, providing (of course) that the additional loudspeakers are not causing destructive acoustical interference among one another.
Yet another approach is to introduce protective limiters that are set to engage before the loudspeaker’s distortion products enter the dreaded non-linear zone. The use of an analyzer will greatly assist in determining where to set the limiter threshold and ratio, but time constants are a different matter.
Unless you have advanced test and measurement skills – and plenty of time to use them – it’s likely that you can arrive at perfectly usable attack and decay settings by ear. Make sure to use music that has similar instrumentation and dynamic content as the program material of the actual show.
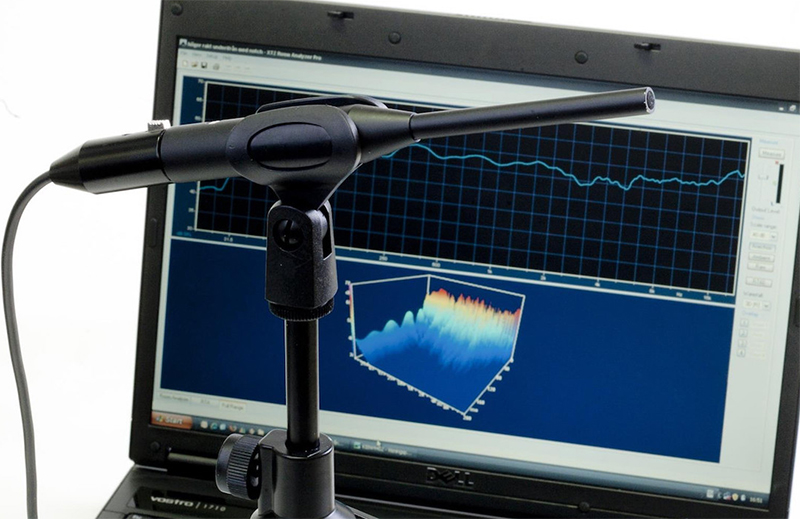
Among the myriad of functions that modern audio analyzers can perform, one that stands out is the waterfall plot. Waterfall plots have their roots in mathematics, long before analyzers existed. They expand on the familiar X-Y Cartesian plot by including a third axis that reveals a new dimension to the information being viewed.
Waterfall plots can be used to display many things, but one of exceptional value is the ability to view the frequency response of a loudspeaker, while at the same time viewing its acceleration and deceleration characteristics, also referred to as transient response (Figure 4).

It’s fascinating to see how some segments of the audible spectrum keep decaying from kinetic energy, while others have already stopped. These measurements are helpful in evaluating a new loudspeaker system or working with an existing one to improve its dampening characteristics.
Note The Differences
While a number of suppliers have introduced value-priced measurement microphones during the past few years, they’re usually intended for use with a loudspeaker controller and are suited only for measuring an approximation of frequency response. It’s important to understand that there’s a significant difference between a mic that’s been designed for a quick frequency response measurement and one that’s painstakingly crafted for flat and linear frequency response, phase response, impulse response, and distortion measurements at a wide range of sound pressure levels.
The long-standing leaders in the field, such as Bruel & Kjaer, have spent decades fine-tuning the efficacy of their products. For truly accurate information when measuring a loudspeaker system, particularly as it applies to distortion and impulse response, a highly accurate measurement mic that’s mated with a compatible mic pre-amp must be used.
There’s a lot more to discuss when it comes to measuring and understanding audio devices; a serious treatment would fill a sizeable book. Today a plethora of analysis products exist that offer varying degrees of usefulness, accuracy, and efficiency for the vast range of tasks that sound system designers and engineers need to accomplish.
Those with the luxury of time and budget will want a complex and versatile analysis system, while others – i.e., a touring club engineer with little time to run a sound check before catching dinner on the fly – will likely want a less costly, portable solution.