Handy Tips
It is also possible to display the spectrum or spectrogram of the input signal.
The spectrogram can be particularly useful during a live performance to help pinpoint feedback frequencies.
Most of the programs I’ve seen display the spectrogram with time on the horizontal axis and frequency on the vertical axis.
SysTune does this as well.
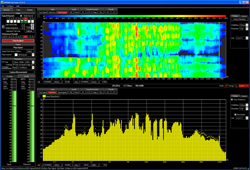
However, it also allows for the axes orientation to be switched.
This places frequency on the horizontal axis to coincide with display of most other frequency vs. magnitude graphs (Figure 3).

SysTune also includes some handy ways to help determine if the displayed measurement data can be trusted or if it should be considered suspect. It does this in two different ways; Coherence and IR Stability.
The coherence function is similar to other programs such as (Rational Acoustics) Smaart and (Meyer Sound) SIM. This is a measure of the correlation between the input signal and the reference signal.
When the coherence value falls below the user-defined threshold, the Coherence Mask can be used to make the measurement data in this same frequency region somewhat transparent.
This can be seen in Figure 4 below 100 Hz and from 2-5 kHz where the coherence value is below 35 percent. Hand claps were used to contaminate the measurement in the higher frequency region.

IR Stability is also a correlation of the input and output of the system under test. However, it does not directly relate the input to the output as coherence does.
Instead it is a differential function that quantifies the similarity of the last two measurements. It is also given as a percentage from 0 to 100 percent as is coherence.
Because IR Stability only looks at the most recent two FFT measurement blocks it can give a fast indication of changes in the data which occur very quickly.