Using Windows Functions
Another useful feature in SysTune is one of the windowing options.
While some standard window functions are available (Rectangular, Tukey 50 percent, Hann and Blackman) a new Time-Frequency-Constant (TFC) window function has been developed by AFMG. This is not a fixed length window, as are the others.
The time length of the TFC window changes as a function of frequency.
The window time is inversely proportional to frequency so that multiplying the window time at a given frequency by that frequency yields a constant value.
As an example, if the window time length is set to 10 ms this is the length for 1 kHz. At 8 kHz the window is 1.25 ms, while at 125 Hz it is 80 ms (see Figure 3 later in this article). This allows reflections to be excluded from the measurement at higher frequencies.
At lower frequencies the window is longer so frequency resolution is increased, on a fixed bandwidth basis. This can also be thought of as having a constant percentage octave frequency resolution across the entire frequency spectrum.
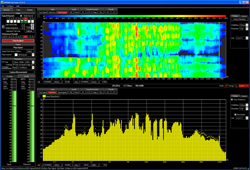
A three-dimensional representation of the TCF window is shown in Figure 1.
One of the most useful aspects of SysTune is the way in which the measurement data can be displayed for the user. There is an upper and lower display graph, either of which can be maximized to fill the entire display if desired.
Any of the possible display selections can be shown in either graph area to suit the user’s preference. The ability to view measurement data in both the time and frequency domains simultaneously can be of great benefit.
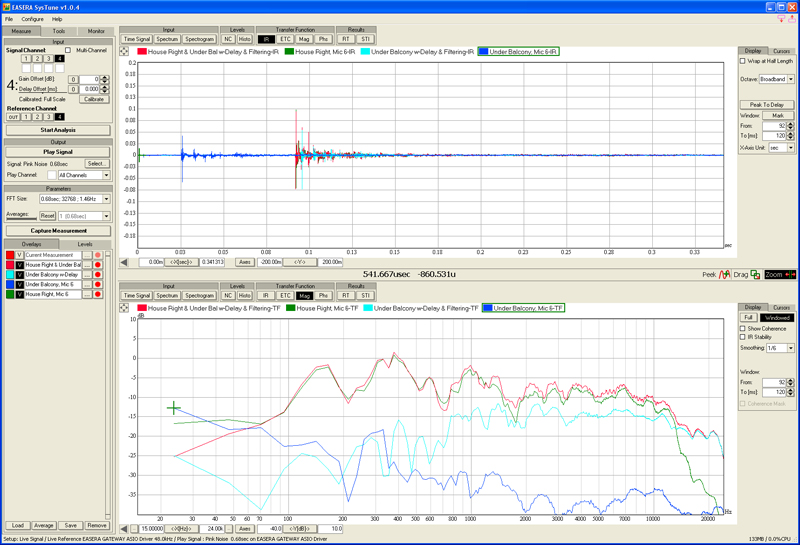
Figure 2 shows captured measurements made during the alignment of an under balcony loudspeaker to one of the main clusters in a large church. The upper graph shows the IR’s while the lower graph shows the transfer functions for a microphone position in the under balcony area.
The green and blue curves are the main house right cluster and the initial measurement of the under balcony loudspeaker, respectively. The signal from the under balcony loudspeaker precedes that of the main cluster by approximately 65 ms at this mic position.
The cyan curve shows the result of applying 70 ms of delay and some filtering to the under balcony loudspeaker. SysTune allowed the delay and EQ to be set relatively quickly while listening to the results to confirm a natural sonic character with the focus of origin at the main house cluster and not at the under balcony loudspeaker.


