
Professional audio is (thankfully) experiencing the early stages of rising awareness around sound exposure, noise pollution, and related issues. In this regard, the United States is lagging behind several other countries in terms of managing these issues in a safe and effective way.
After spending some time reading up on the current recommendations for sound exposure from the National Institute for Occupational Safety and Health (NIOSH), I decided to collect SPL and sound exposure measurements from a series of concerts I worked on over the last few months.
NIOSH sets out recommended noise exposure limits in its document “Occupational Noise Exposure: Revised Criteria 1998” (publication number 98-126, available for download from cdc.gov/niosh). These guidelines are of interest to those in our line of work: the more well-known OSHA Permissible Exposure Limits serve only to indicate the point at which an employer becomes legally obligated to protect its employees from noise exposure, but they are not designed to protect or preserve an individual’s hearing.
That’s the purpose of the NIOSH Recommended Exposure Levels, which are far more stringent and also far more effective at preventing noise-induced hearing loss (NIHL) in an occupational setting. I won’t rehash the NIOSH guidelines here, but they, as well as the underlying research, are well explained in the Criteria document.
To the Limit
Seeking to get a handle on what sort of occupational sound dosages myself, and my fellow crew members, as well as audience members, were being exposed to at these events, I then plotted the NIOSH exposure data into a chart (Figure 1). The data is sorted by performance duration (longer performances on the right). The data is stated in percent dose, with 100 percent representing the full recommended exposure limit for the day.
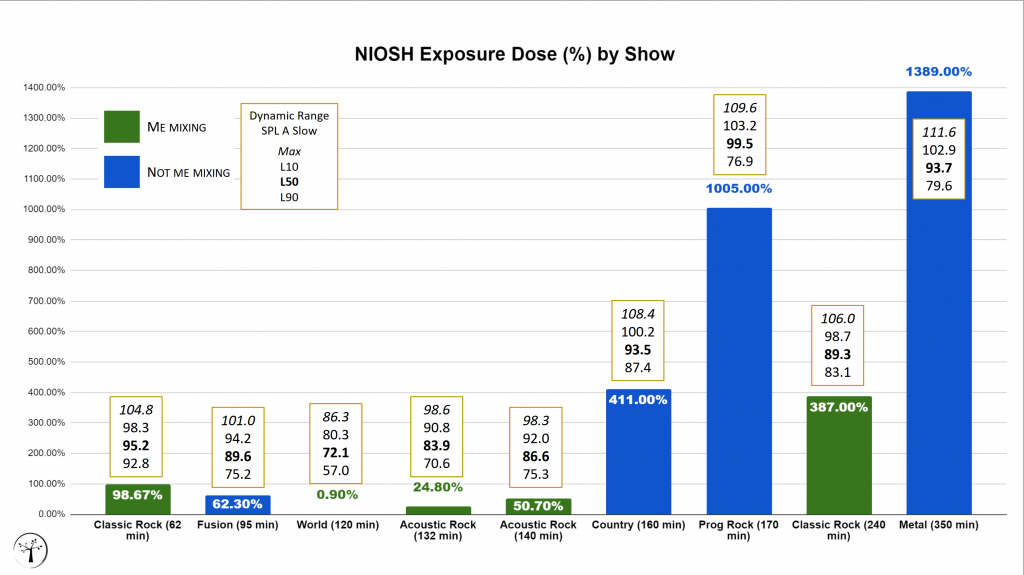
Green bars indicate shows that I mixed (I had control of the level), while blue bars indicate shows mixed by another individual (I had no control over the level). The genre of the event, along with the length in minutes, appears below each bar. The 350-minute metal show was a touring bill with five bands, hence the length of the event. The 240-minute classic rock show was a multi-act show in a small club, and the 170-minute progressive rock was a well-known prog rock band that played a single long set.
Inside the gold boxes is dynamic range information for each event. Although A-weighted, C-weighted, and Z-weighted data was logged for each event, I focus here on A-weighted data (specifically SPL A Slow) since it forms the basis of the Exposure calculations.
The top (italicized) value, Max, indicates the Max SPL A Slow value logged during the event. The second value down, L10, which represents the highest 10% of all the readings recorded – in other words, 90 percent of all individual readings taken were below this level.
The third (bolded) value down, L50, is the median level – half of the values recorded were less than or equal to this value, and half were higher. The fourth value down, L90, is the level that was exceeded 90 percent of the time and is generally regarded as a useful indicator of background noise levels. Taken together, these statistics give us information about the dynamic range of the event.
I have included these because they illustrate an important concept: sound exposure is not just about “how loud” but also “how long.” The metal show, despite representing a massive exposure dose for the audience, wasn’t as “loud” on average as some of the other, lower-exposure performances. The length of the event means that even at a reasonable level, it would represent a very high exposure. (For a show that length to clock in at 100 percent dose, it would have to be 82.3 dBA.)


