
Two-dimensional graphs are useful for displaying sound system component specifications, but a third dimension is required for considering parameters that are a function of (depend on) a position in space.
This includes two data types that are absolutely essential to the sound system designer – loudspeaker directivity data and computer models of auditoriums.
Let’s investigate the use of three-dimensional graphs for describing the radiation from loudspeakers.
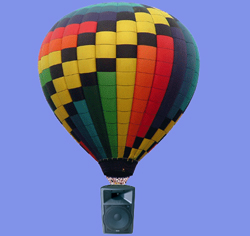
Why is this data needed? Sound radiation is a three-dimensional disturbance that (in most cases) expands as it propagates. The wavefront from a very small source might resemble the shape of a spherical balloon as it is inflated. It’s convenient to consider that sound energy radiation has as its origin a single point in space (a “point” source).
While not physically possible, this theoretical source forms the basis for understanding how energy radiates from all types of realizable sources. The radiation balloon from a point source would expand uniformly in all directions as it propagated outward from the origin. This source is referred to as a monopole, and the radiation pattern as omni-directional.
If all loudspeakers were omni-directional, there would be no need to describe their radiation graphically. One could use the simple inverse-square law to determine the attenuation of the pressure wave as it propagates outward from the source (sound doesn’t die out, it spreads out).
Conveniently, the attenuation would be the same in any direction. It can be shown geometrically that the area of an expanding sphere grows with the square of the increase in radius – double the radius and you get four times the surface area (Figure 1).
Because the coverage area expands, the energy density collapses, and the result is a 6 dB drop in sound level for each doubling of distance (quadrupling of area) from the origin. Note that this is only true for a point source. Other source types (i.e. line or planar) do not follow the inverse-square law.

A point-source radiator would be of limited usefulness in a sound system. Most loudspeakers utilize interference to concentrate the sound energy in a specific direction. Pattern control horns, room boundaries, and even cupped hands are means of controlling sound radiation.
Like camera lenses of differing focal lengths, a wide variety of patterns are necessary and available. A graphical means of representing the patterns is useful to allow comparisons between various devices.
POLE POSITION
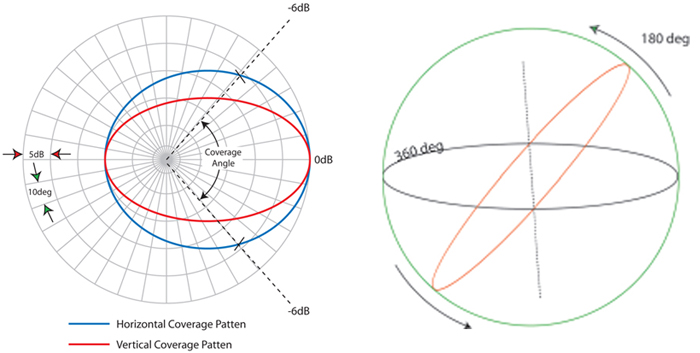
The oldest method of graphing directivity is the two-dimensional polar plot. The loudspeaker is measured at an appropriate angular resolution and distance and the relative levels plotted on a polar graph. Both horizontal and vertical plots are measured.
The coverage angle of the loudspeaker is defined by the -6 dB points on the plot relative to on-axis. A popular resolution is 1/1-octave at 10-deg rotation (Figure 2). While better than nothing, the polar plot has been almost completely supplanted by the three-dimensional attenuation balloon. But first, some background.
A circle can be divided into 360 degrees. If one is mounted on “gimbals” and rotated 180-degrees, the surface area of an entire sphere is swept. So, the coverage angles that describe spherical radiation (omni-directivity) are 360 degrees by 180 degrees (Figure 3).
This fact makes a great trivia question for parties and after-dinner conversations. If one measurement were performed per degree of rotation, nearly 65,000 measurements would be required to characterize the spherical radiation from a single loudspeaker!
A more practical angular rotation is 10 degrees per step, with the next meaningful resolution increase requiring a halving of the rotation angle. This makes 5 degrees the “next better” resolution, then 2.5 degrees, and so on.
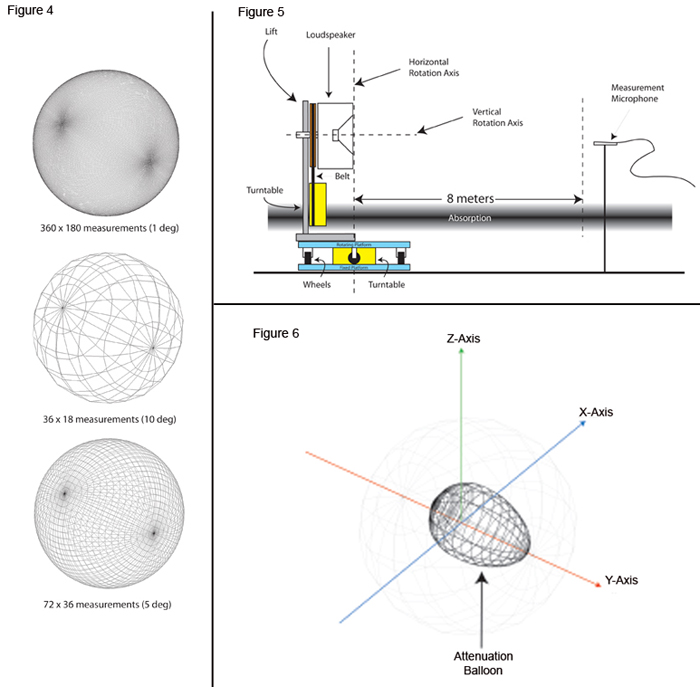
Because each halving of the rotation angle quadruples the number of measurement positions, we can’t get too carried away. Five-degree angular resolution (Figure 4) requires over 2,500 individual measurements per loudspeaker! This represents the practical limit of current hardware and software, and approaches the point-of-diminishing-returns on the information density.
ATTENUATION BALLOON
An attenuation balloon is measured by placing the loudspeaker onto a “positioning” apparatus that allows the loudspeaker to be rotated around an origin and aimed in any direction (Figure 5). A precision microphone is used to measure the sound level at an appropriate reference distance in the far field of the loudspeaker. (That’s a different topic – here we simplify it to mean “at a remote distance.”)
The highest sound level (usually on-axis) is used as a reference and the levels at other angles are plotted in relation to it. The resultant “balloon” will reveal the loudspeaker’s three-dimensional directivity characteristics as a function of frequency (Figure 6).
Two important parameters can be determined from this plot – where sound is going, and where sound is not going. The interaction of two or more loudspeakers can be determined by “superposing” their balloons. This is the heart and soul of loudspeaker array design, as it allows the relative level and arrival time of sound from the array to be determined at any point in three-dimensional space.
If high enough angular resolution is used, most of the energy leaving the source has been documented. Now some useful ratios can be derived from the data. The ratio of the on-axis squared sound pressure to the average squared sound pressure is the loudspeaker’s axial directivity factor, or Q.
Expressed in decibels, the Q becomes the directivity index, DI. Q and DI were considered as a function of frequency on a two-dimensional graph in last month’s article. So, now we can have a 2-D graph of directivity versus frequency for each point on the sphere.
That’s a lot of graphs, so only the axial position is usually plotted in this manner. Loudspeakers suitable for sound reinforcement applications have directivity factors >1, often by one or two orders of magnitude (x 10, x 100).
FINISHED PRODUCT
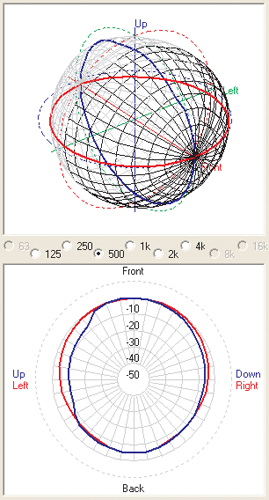
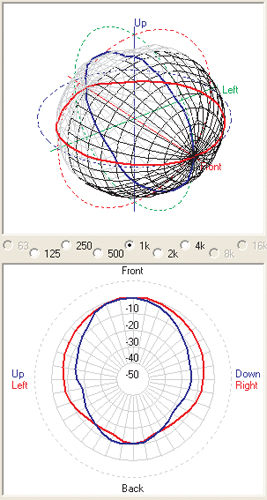
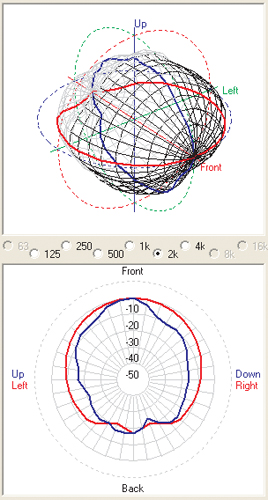
In Figures 7 – 10, we see some frequency-dependent radiation balloons along with their two-dimensional polar plots. The angular resolution is 10 degrees, and the frequency resolution is one octave. The smaller balloons at high frequency indicate a tighter radiation pattern (higher Q).
At low frequency, most loudspeakers radiate energy omni-directionally (Q = 1). Both extremes have been the bane of loudspeaker designers since the invention of the device. Successful designs attempt to increase Q at low frequency where sound wants to go everywhere and reduce it at high frequency where it wants to focus.