
Rotator – The ELF
In order to perform accurate full-sphere directivity balloon measurements, loudspeakers must be mounted to a 2-axis rotator. The measurements need to generate complex data (both magnitude and phase) up to very high frequencies, and accomplishing this requires precise, accurate, and repeatable positioning of the loudspeaker.
There are a few commercially available 2-axis rotation systems, but Hughes states that the ELF robot from Four Audio stood apart due to a very small acoustical reflection profile. “The steel tubing used to construct it doesn’t eliminate all reflections from the rotator, but it does limit them to higher frequencies and reduces them in level by directing them in different directions,” he says.
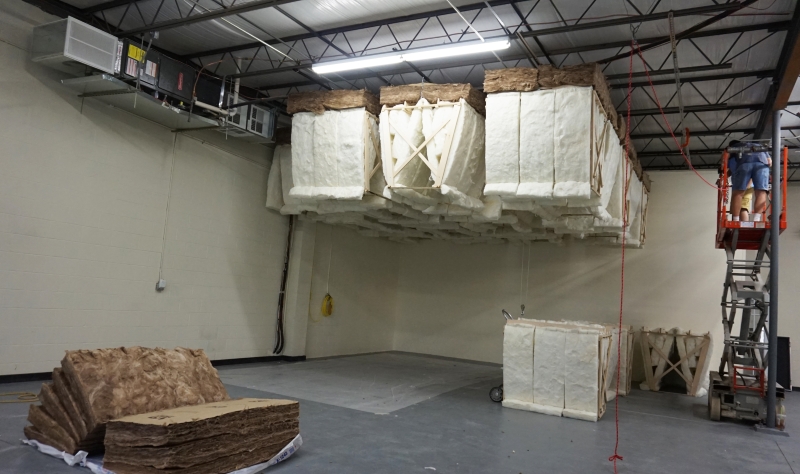
Loads of up to 220 pounds to be mounted and rotated on the ELF, allowing some quite large loudspeakers to be measured (Figure 6). It’s capable of an angular resolution of 1 degree, although 5-degree and 2-degree resolutions are most commonly used by Excelsior Audio.
Further Details
It’s important that measurements are made in the far-field of the device under test (DUT). A device’s far-field is a function of both its physical size and the frequencies at which it operates, with even modest-sized loudspeakers used in the professional/commercial audio industry having a far-field that is several feet away from the device. Excelsior Audio performs most measurements at a distance of more than 20 feet, which helps to assure the measurement data is acquired in the far-field.
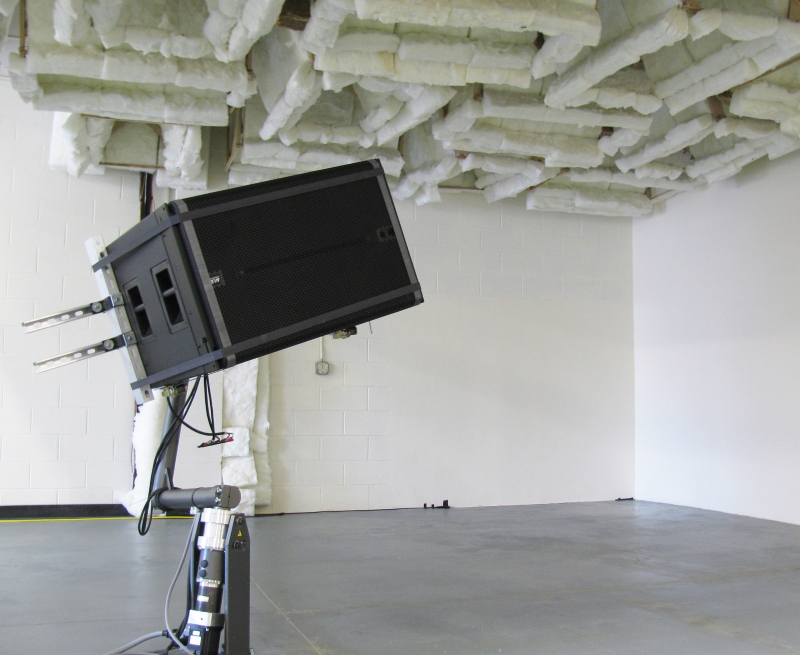
The finished measurement space (Figure 7) allows the first reflection to arrive at the measurement microphone about 40 ms after the arrival of the direct sound from the DUT. The application of an IR window to eliminate this reflection from the measurement data results in a frequency resolution of about 35 Hz. This IR window also results in some frequency domain smoothing of the data that is noticeable a couple of octaves above that frequency.
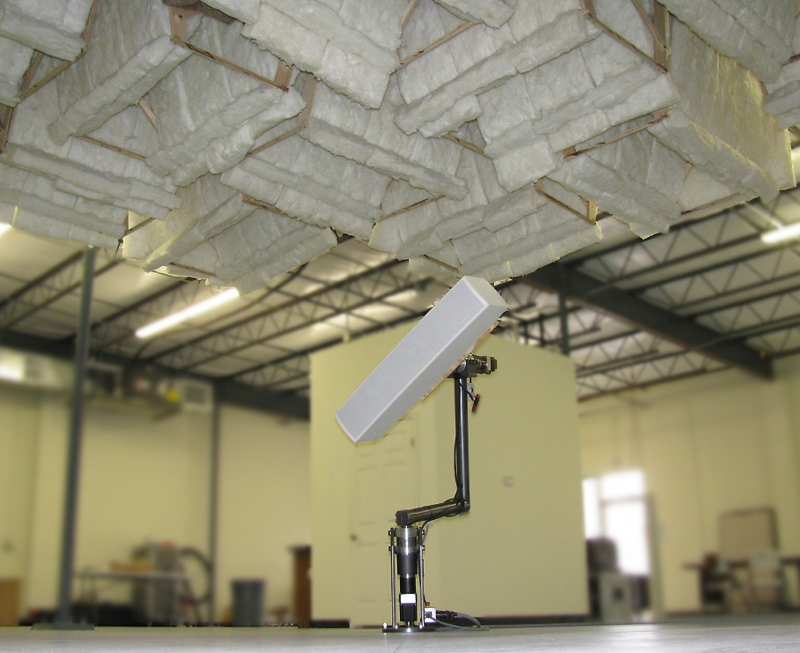
As noted earlier, a typical measurement mic can’t be used because of its size, so instead, the choice is a very small mic from DPA (again, Figure 3) with a diameter of about 5 mm. “Since it’s not a laboratory grade measurement mic, the frequency response is not as flat as it needs to be for this application,” Hughes explains. “Nonetheless, it’s a very nice mic and quite useful for a variety of applications requiring a very small diaphragm.”
He adds that extensive measurements were performed comparing the DPA mic and a laboratory grade model using the same loudspeaker and measurement location, with a compensation curve created to correct the complex response (both magnitude and phase) of the DPA mic. The measurement software Excelsior Audio employs – EASERA from AFMG – applies this compensation to every measurement, and the result is equivalent to using the laboratory grade mic for a free-field measurement.
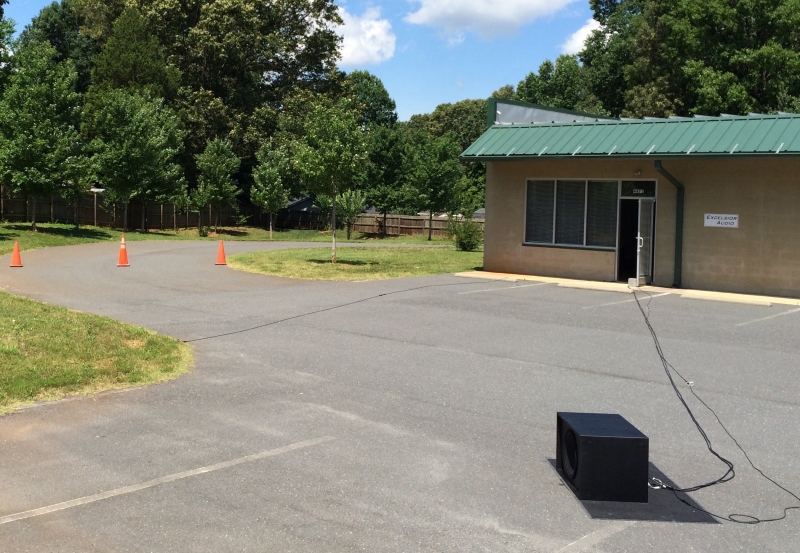
When extremely accurate low-frequency data is required, the on-axis frequency response of a loudspeaker will be measured outside in the parking lot using a ground-plane measurement technique (Figure 8). This may be necessary for the low-frequency pass band of a large, full-range loudspeaker or for a subwoofer.
These measurements are also typically made at over 20 feet, with the first reflection occurs greater than 100 ms after the arrival of the direct sound from the DUT. The IR window used to eliminate this reflection results in frequency resolution of about 15 Hz.
Multiple Benefits
Hughes has built an operation that’s very well suited to perform accurate measurements to generate complex data for both the on-axis and off-axis frequency responses of loudspeaker systems, which enables loudspeaker modeling files to be generated that can be used in acoustical modeling programs. These same modeling files can also be used to help with crossover design.
Having complex directivity data for each pass band of the loudspeaker allows not only the on-axis frequency response to be simulated using a proposed crossover design, but also the off-axis frequency response.
“This can be extremely important to the coverage pattern of the loudspeaker as well as its overall sound quality,” Hughes concludes.
“Such simulations require no additional measurements and can be accomplished in seconds. Being able to see the effects of the crossover filters, EQ, and delay on the resulting directivity of the loudspeaker allows the directivity response of the loudspeaker to be optimized through the crossover region.”