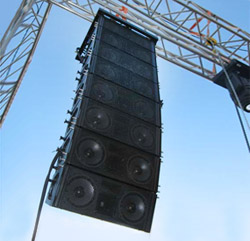
Factors The Reduce The HF Requirement
We may not need line arrays with a full, high-frequency, power-bandwidth response.
There are three factors that reduce high-frequency demand:
1) The General Nature of Music. The loudness of musical signals is less at high Frequencies. This has been confirmed by several studies done over the last 20 years.
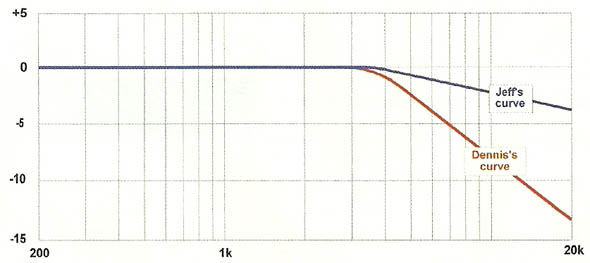
Dennis Bohn, founder and technical architect at Rane Corporation, discusses this issue in an electronics application note (available here) about analog long-line drivers. He gives a conservative rule of thumb for high-frequency signal level as flat to 5 kHz, then falling at 6 dB per octave above that.
I will add something to his picture: Peaks. The fact is that a 20-dB headroom for peaks has been the industry standard since the first mixers for broadcast in the 1920s and 30s.
Hence the +4 dBu nominal and +24 dBu maximum level for most pro audio gear. The “10 dB rule” is probably a rule of thumb for rock ‘n’ roll road dogs using limiters to make it as loud as possible.
Over the years, I’ve seen tors of shows where the signal above, say, 7 kHz, has very big peaks. If the sound system is properly set up, its limiters will kick in when it runs out of steam, and the high-frequency peaks will be removed with no damage to the loudspeakers and only a moderate negative effect on the sound.
If the system does have enough high-frequency headroom for limiting not to occur, it will sound airier and more impactful on the high end.
Figure 5 offers two curves – mine and Dennis’s. My curve has more allowance for peaks.
2) Style Of Program Material. Some research studies have shown that maximum high-frequency level depends on the type of program. For musical programs, the usual results have shown that classical music, jazz, and pop have reduced high-frequency requirements.
Rock, however, has a relatively flat maximum output spectrum, and therefore requires a power bandwidth response that remains strong all the way to the top.
3) Compensating Effects Of Human Hearing. In reverberant environments, where the listener is immersed in a sea of sound coming from all directions, the sound waves diffract around the human head in such a way as to produce a net boost of about 9 dB with a peak around 8 kHz.
The human hearing transfer function is described well in a classic Audio Engineering Society (AES) paper by the late Robert B. Schulein of Shure Brothers. Well-written and easy to read, the paper is called In Situ Measurement and Equalization of Sound Reproduction Systems.
Published in April 1975, it describes a series of experiments that Schulein did to determine the reasons for the so-called “house curve” (a.k.a., “X-curve”), a 3 dB per octave roll-off above about 1,500 Hz that is traditionally applied to cinema and auditorium sound systems.
The paper identifies the role of head diffraction in determining the listening experience in reverberant environments. It’s an important piece, and I think that everyone involved in designing and tuning large sound systems should read it.
Figure 6 illustrates the curve that Schulein derived. It shows the transfer function of the ear when the head is immersed in a pure reverberant sound field, where the sound is coming equally from all directions. Such fields are found at most of the seats in an arena concert.
As you can see, the ear helps the tweeters out quite a bit in reverberant environments. On the other hand, in non-reverberant (anechoic) environments – outdoors, for example – this curve does not apply, and the tweeters have to do all their own work.
Effective Power-Bandwidth Response
To understand the array’s performance in an actual gig, we combine the ear’s transfer function with the array’s power bandwidth response. The result is a curve that I will call the Effective Power-Bandwidth Response (EPBR).
The EPBR is the perceived maximum sound pressure that the array can deliver. “Perceived” means that the curve is adjusted for the ear’s transfer function.
As we’ve seen, the ear’s transfer function is different in reverberant and non-reverberant venues, so we have to handle those two cases separately, None of these CUIVes include any effects of air attenuation. If air attenuation were to be included, it would make things look even worse!
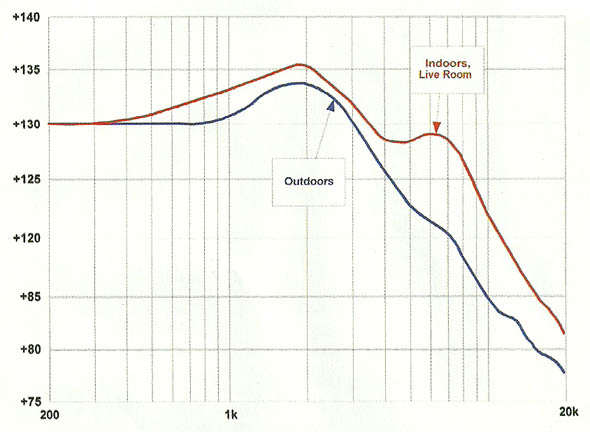
Figure 7 shows the EPBR for reverberant (indoor) and nonreverberant (outdoor) venues. Did you ever hear a line array in an arena gig and wonder why it sounded pretty good, but only up to about 7-8 kHz? I certainly have. Now we can start to see why.
As you can see, for outdoor shows the problem is severe. Who hasn’t been to an outdoor show where everybody was blaming the wind for the lack of high end, or the heat, or the humidity. Clearly, they’re not the only issue.
Effective Headroom
To see how the EPBR affects a particular show, we must compare it with the spectral content of the audio program.
I define the term Effective Headroom (EH) as the difference between the EPB and the spectral amplitude curve of the program material.
As we saw, the estimated spectral content curve depends on the type of program material and on who’s doing the estimating.
Indoors
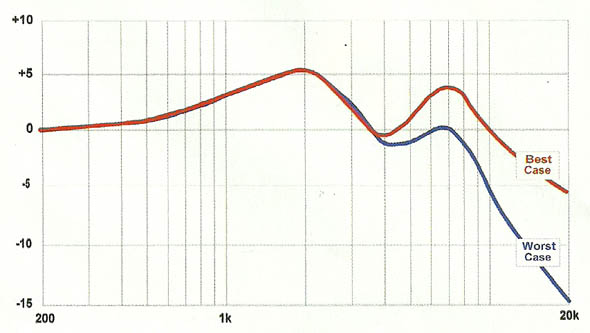
The best-case scenarios use Dennis Bohn’s spectral content estimate, the worst-case ones use mine.
Here they are in Figure 8 for reverberant venues. This isn’t too bad—best-case headroom is only 5 dB down at 20 kHz.
If it’s well run, the rig would lose openness and airiness at high levels, but otherwise would probably sound OK. However, an intense high-SPL high frequency experience would not be available.
Outdoors
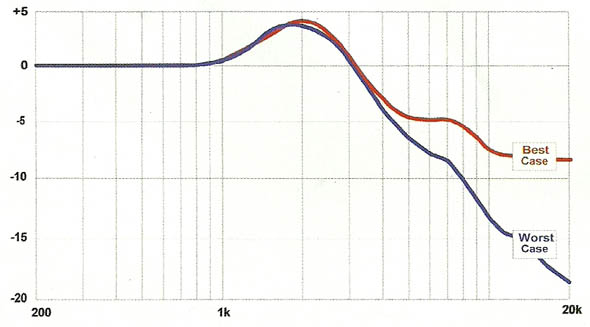
Figure 9 shows EH for non-reverberant venues. These curves say that things will sound quite dull whenever the rig is working hard.

