Analyzer Types
Now, some traditional, common-usage definitions of analyzer types and measurement methods:
Real-Time Analyzer (RTA) – Measures the frequency response magnitude in real-time. The data is usually octave-banded (or fractions thereof) and results from pink noise being played through the system.
There is no phase data, so this response is “time blind.” The RTA displayes the magnitude of each 1/n-octave band, but nothing about their time relationship. An RTA measures the stimulus along with how it is modified by the loudspeaker and room.
Early RTAs were basically a bank of sound level meters driven through fractional-octave filters. Modern RTAs measure in the time domain and compute the spectrum using the FFT. The data can optionally be octave-banded for display. This emulates the traditional RTA.
RTAs are the simplest “frequency analyzers” to use. Just place the mic, excite the system, and observe the response. But since the measurement is blind to the arrival time (and direction) of the sound, the observed response may have little to do wit what a human perceives when listening at the same position. This is an aspect of measurement that the more sophisticated measurement processes attempt to address.
Dual-Channel FFT – Measures the impulse response (or transfer function) by comparing the signal fed into the system to the signal re-acquired through the measurement microphone. A dual-channel FFT measures what happened to the reference signal, not the signal itself. As such, many different broadband stimuli can be used (even music).
Discrete Method – The system is excited with a stimulus, and the resultant IR is manually time windowed (by the placement of cursors to mark the window edges) and the transfer function observed. Each is a discrete step. If I make changes with an equalizer, I will need to repeat the measurement to observe the effect of the filter.
Real-Time Transfer Function – The process of collecting the time domain signal, comparing it to the reference signal, time windowing, and FFT-ing to the frequency domain, done at such blinding speeds that the transfer function is given in pseudo real-time and updated continuously. It is a “running” measurement that can allow system tuning to be performed during a show. The effect of filtering is immediately seen and heard, since the measurement is ongoing.
Coherence Plot – A frequency domain plot used with the real-time transfer function that indicates the likelihood that the observed response is valid, based on the input and output signals of the system. High coherence suggests good data. For the discrete method, repeatability is the “acid test” for good data.
Stimulus Types
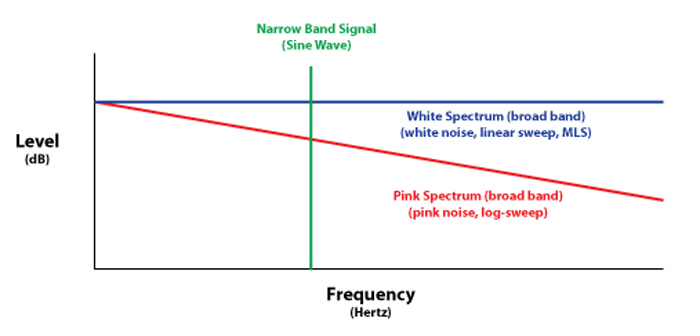
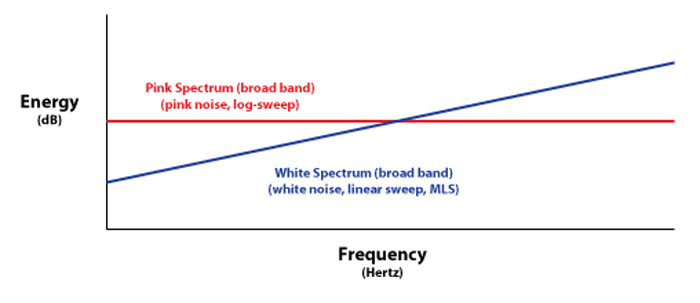
White Spectrum – A stimulus with equal energy per Hz. Examples include an impulse, white noise and linear sine wave sweeps. White spectra have energy that increases with frequency (since there are more “Hz” in the higher octaves than the lower ones), and typically yield poor signal-to-noise ratio at low frequencies (Figures 15 and 16).
Pink Spectrum – A stimulus with equal energy per octave. Examples include pink noise and log sine wave sweeps. A pink spectra voltage contains more low frequency energy (and less high frequency energy) than an equivalent white spectra voltage. Most general sound system testing methods utilize pink spectra.
Narrow Band Stimulus – A stimulus having limited spectral content, such as a sine wave (Figure 15).
Broad Band Stimulus – A stimulus having broad spectral content, typically covering the entire audible spectrum. Examples include unfiltered noise and impulses.
Putting It All Together
Here is an example of how all of the terms in the glossary might be used to describe the measurement process used for sound system tuning session:
I wish to improve the frequency response of my loudspeaker through equalization. I will collect the impulse response using a pink spectrum signal (pink noise or log sine sweep), fed into the system from the sound card output of my dual-channel FFT measurement platform. This signal is also looped back into one of the inputs, allowing the analyzer to compare it to the signal picked up by the measurement microphone.
The resultant IR is displayed as a log-squared response to better visualize relative levels of the sound energy arrivals. I bypassed the compressor/limiter blocks of my DSP, to assure that the system response is linear. The mic was placed on the floor plane, and I made sure that no one was moving near the mic or loudspeaker.
This, along with turning off the ceiling fans assured that the system was time invariant. A time window is placed around the direct arrival, to exclude room reflections. Performing an FFT produces a transfer function that is free of comb filters. A shaped time window is used to avoid an abrupt interruption of the time domain signal, and the resultant anomalies in the frequency domain.
Equalizer filters are placed on bumps in the frequency response magnitude. Since these bumps are minimum phase, the equalization process also improves the loudspeaker’s phase response. The phase wrap at crossover of the 2-way loudspeaker is non-minimum phase due to the IIR crossover filters used in my digital signal processor. I have to live with it. The phase response could possibly be improved by using FIR digital filters, at the expense of increased overall group delay.
Since I am tuning the system before the event, I am using a discrete measurement method. While any broad band stimulus could be used, I will use one with a pink spectrum so as to provide equal energy to the system in each octave band. This assures that I don’t smoke my tweeters while trying to energize the subwoofer.
Later, I will monitor the response during the event using a real-time transfer function to assess the effect of the increased absorption presented by the audience as the room fills up. Since my earlier measurements used a mic placement that ignored the floor reflection, minimal adjustment of the equalizer is needed for “audience compensation.” The coherence plot indicates whether the data can be trusted. It is needed because the spectrum of the music signal is continuously changing, and there may be time variance caused by people moving around.
Conclusion
That’s a general overview of the terms and their application. The principles are universal and apply to all measurement platforms. Some of the definitions were slanted toward their general use in audio and acoustic measurements. As with all theoretical concepts, some of the definitions could be challenged on the fine details, especially with regard to their general use outside of audio and acoustics.
That’s one of the reasons that I love this business.


